
Digital Attribution
AI model that credits every touchpoint in the journey by how much it actually moved the sale, using your conversion data rather than ad platform pixels


Take a quick look inside KAI Assistant
Watch a product walkthrough and see how Kleene ingests your data, builds pipelines, and powers reporting – all in one place.


Ask AI whether Kleene.ai is right for you


What is digital attribution?

What it does
Looks at every step a customer took before buying and works out how much each one contributed.

How AI works with it
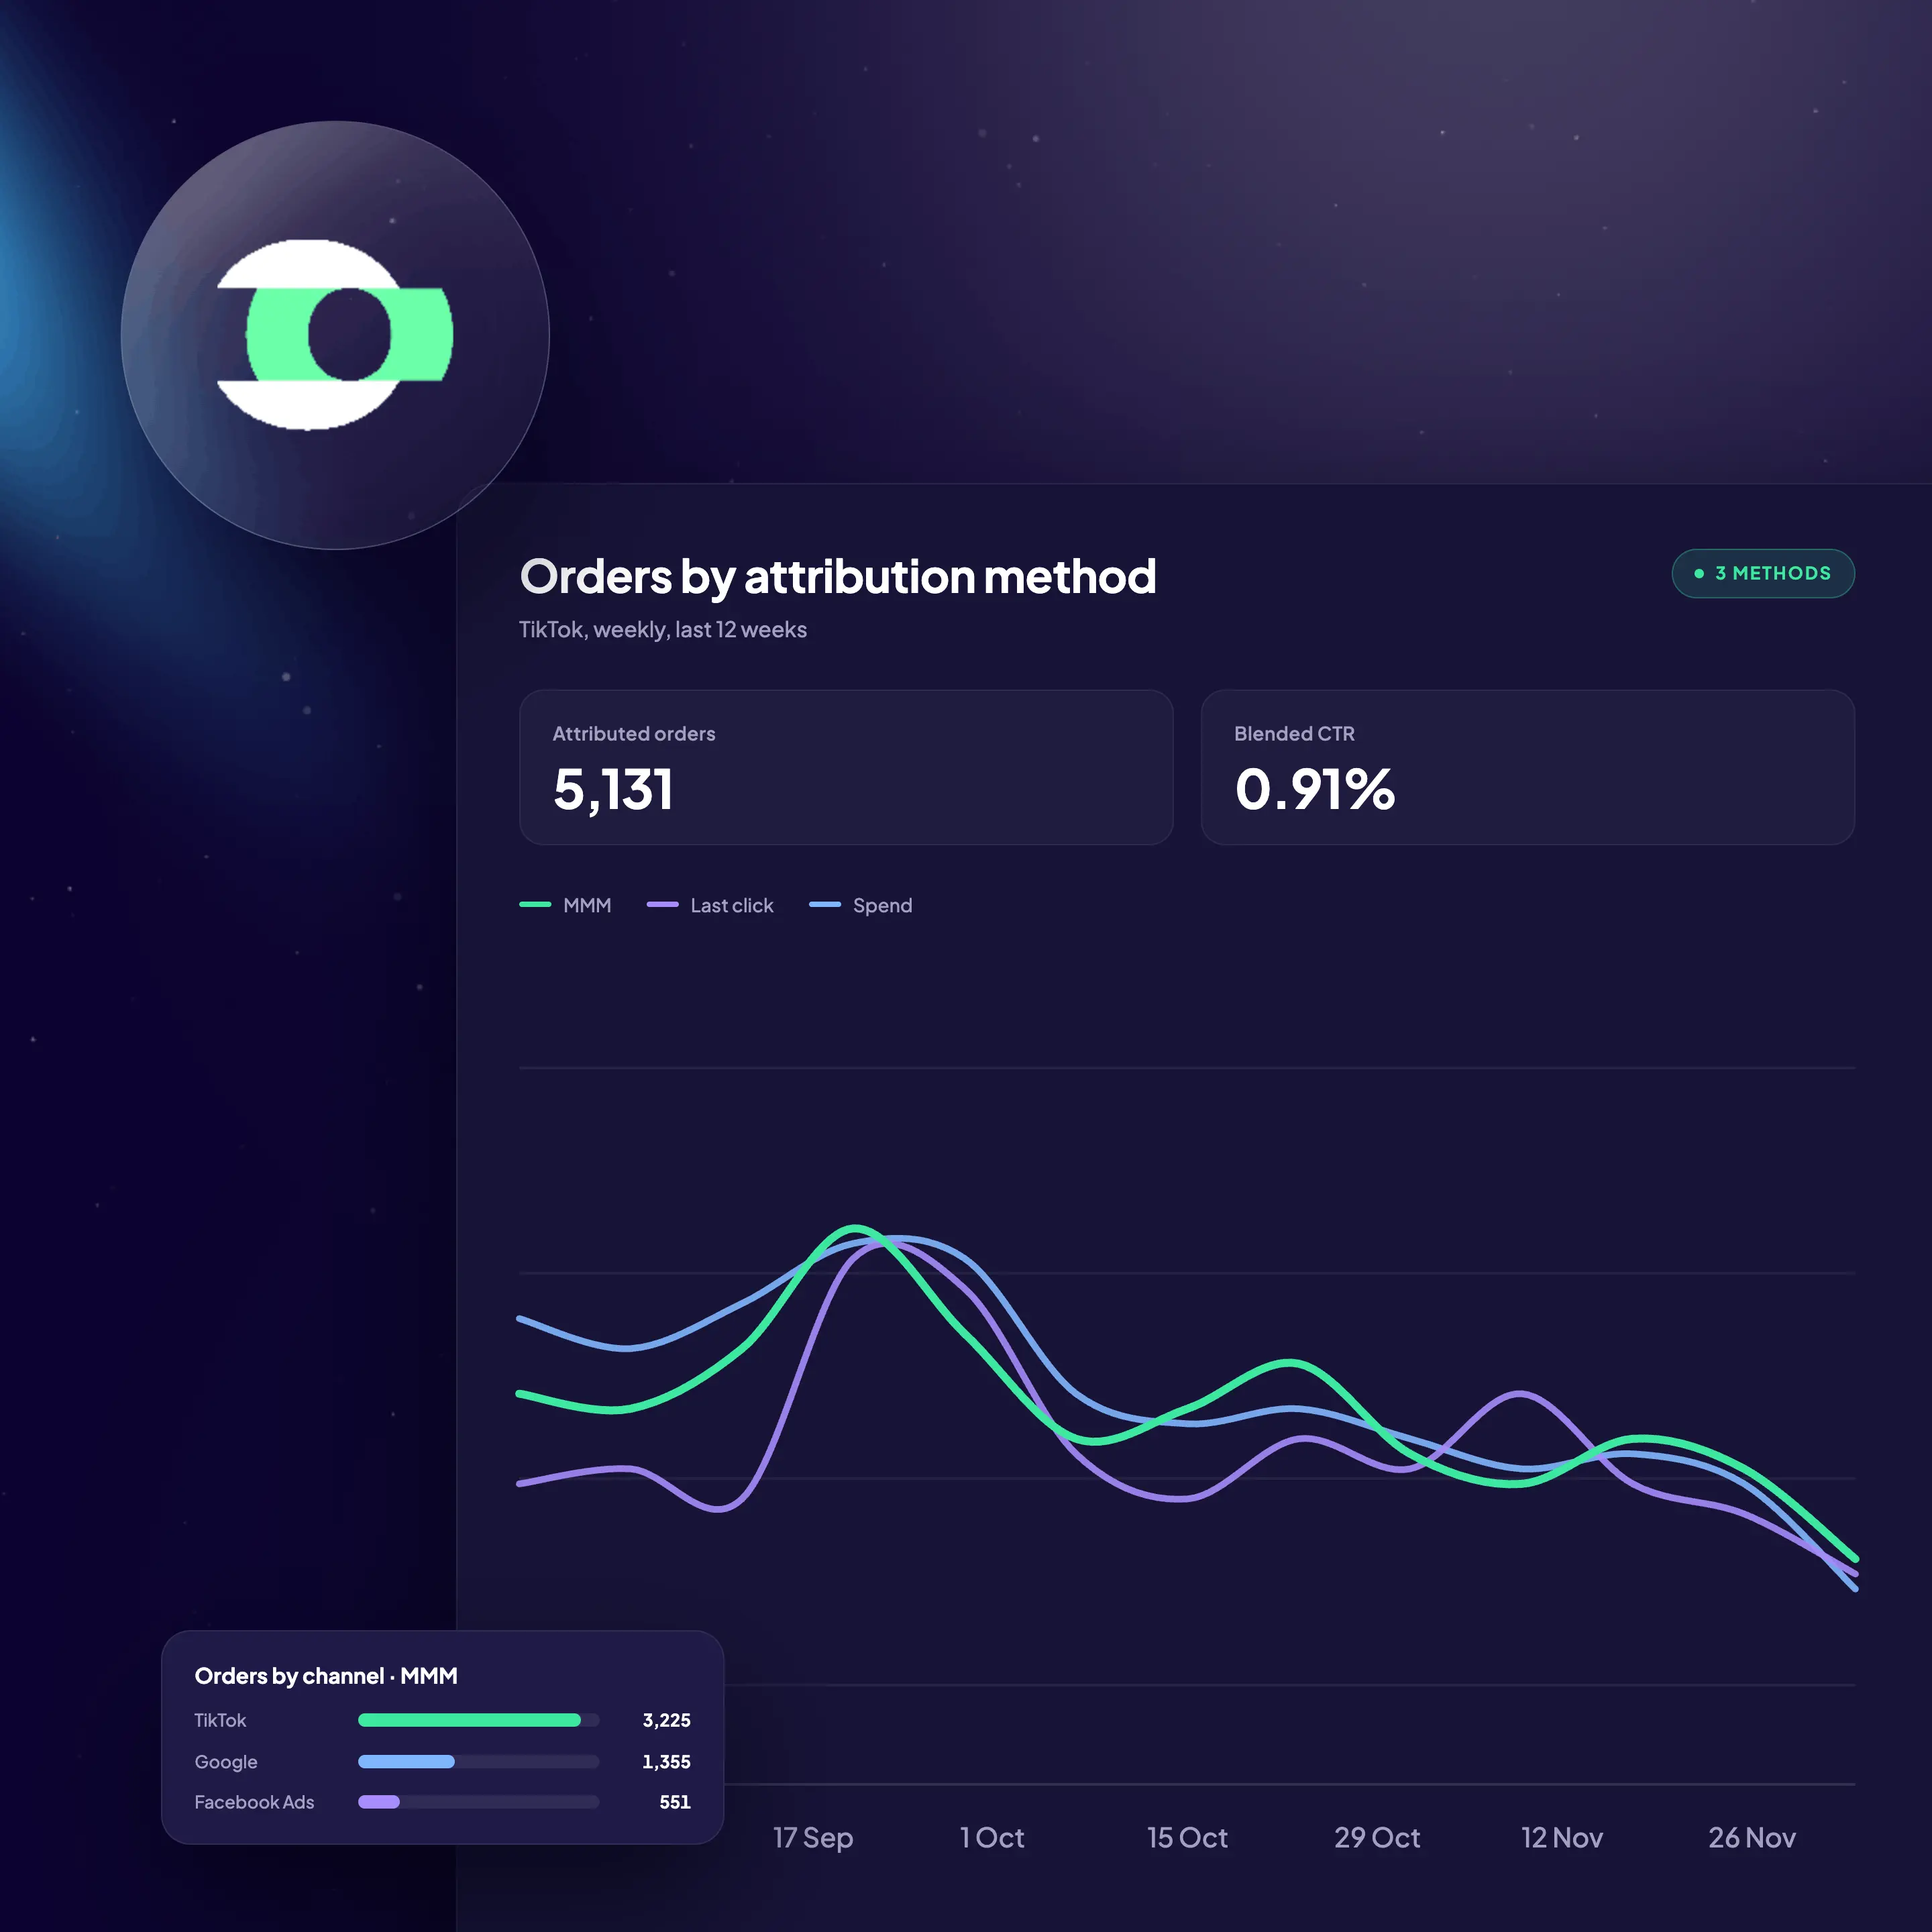
Instead of a rule like last click, it simulates removing each channel from real customer journeys and measures how many sales disappear. It runs on your data, not platform pixels.

What is does for your business
Branded search stops taking credit for demand that social and email created. Clients typically cut ad spend by 10 to 25% without losing conversions.


%201.svg)
how it works
How does our digital attribution model work?

Connect journey and conversion data
Event tracking captures where traffic came from, client side or server side. Conversions come from your source of truth, whether that's your database, CRM, commerce platform or ERP. A data audit confirms the two line up before any modeling starts.

Estimate the weights
Markov chains and Shapley evaluation simulate removing each marketing activity and every journey attached to it. Conversions lost relative to journeys lost sets that activity's weight. Every touchpoint on every conversion is then credited by its estimated influence.

Optimize bids and budget
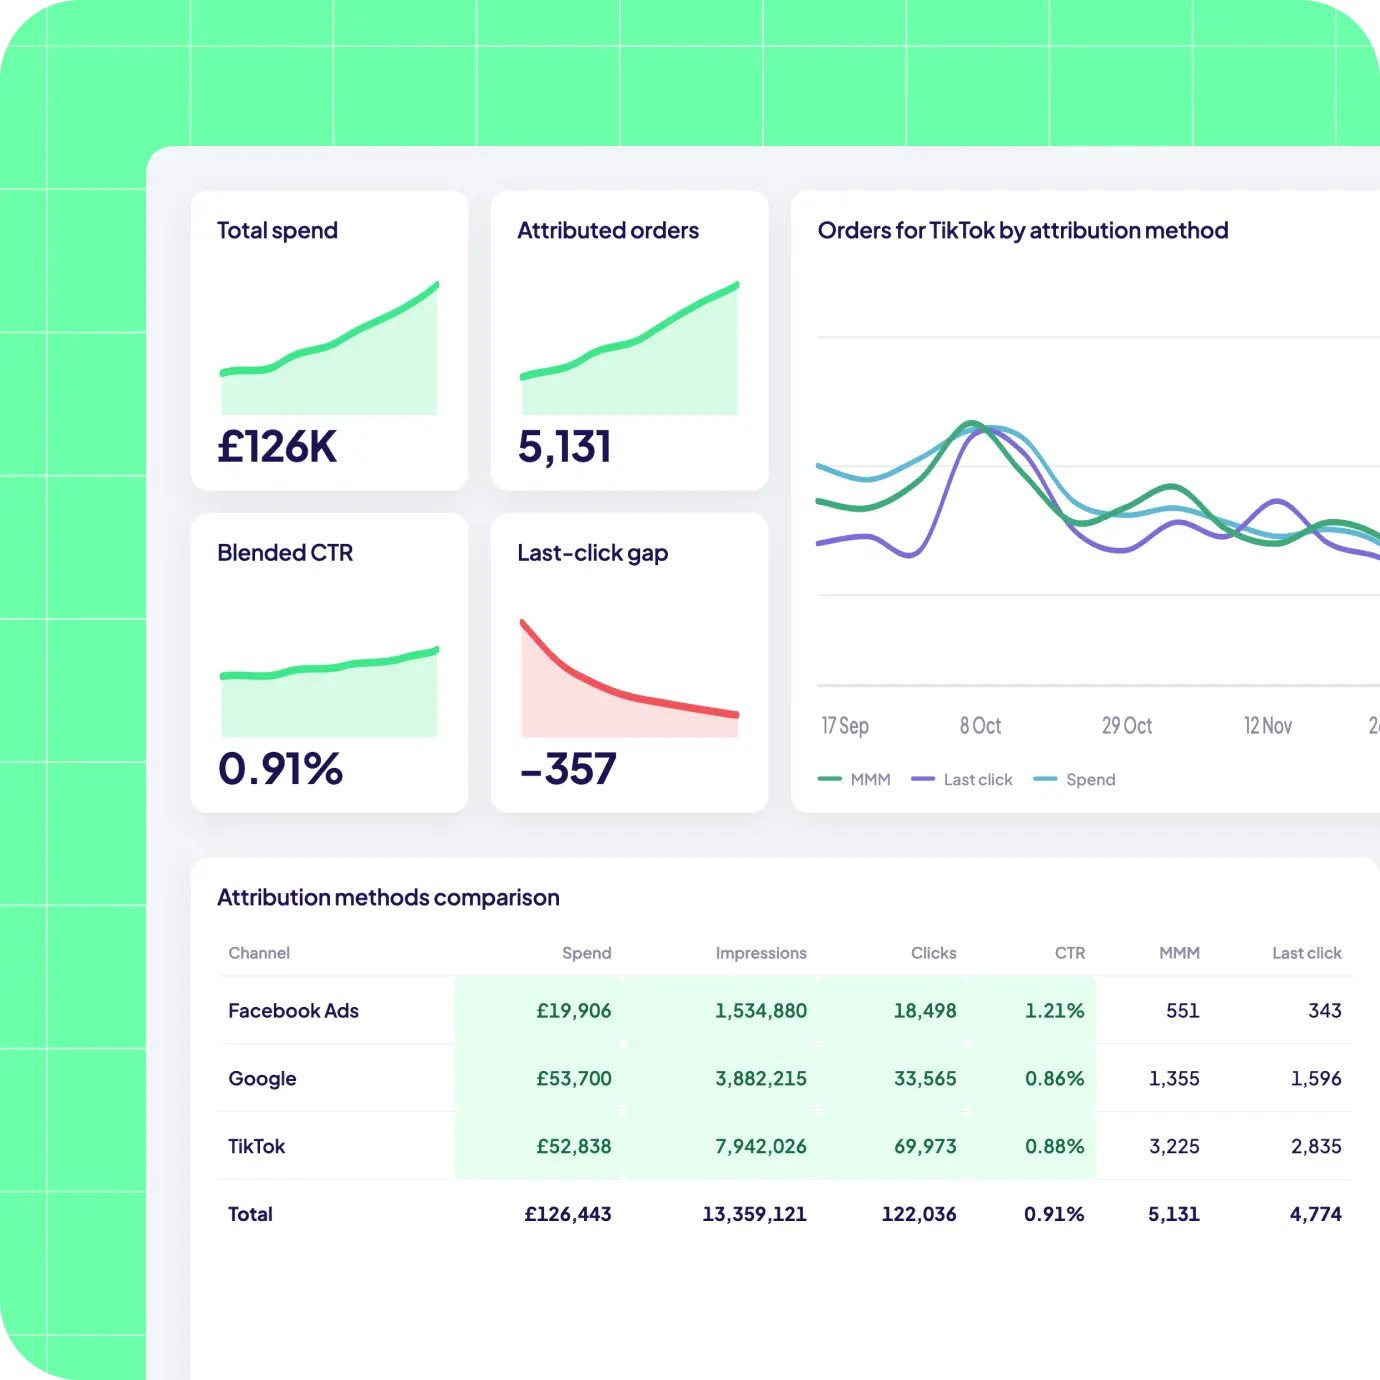
Credit per touchpoint gives you true CPA, ROAS and revenue down to individual ads. Those numbers drive bid and budget decisions, and fuse with media mix modeling to cover TV, impressions and offline activity that click data can't see.
Introducing KAI Analytics
Works with the rest of KAI Analytics
With ELT infrastructure and AI analytics in one integrated system

Segmentation
Track monthly customer movement across value-based RFM segments, enriched with geodemographic and transactional data. Quantify value gained or lost as customers shift between segments — enabling smarter retention and acquisition decisions.

Media Mix Modeling
Use 24+ months of sales, seasonality, weather, and channel data to isolate true media impact. Optimize budget allocation and improve marketing ROI.

Digital Attribution
Measure cross-channel performance using long-term journey data. Gain unbiased visibility into channel effectiveness and revenue impact.

Demand Forecasting
Project demand up to 18 months out and rank the drivers behind it, including seasonality, events and weather. Test scenarios before committing to a plan.

Inventory Management
Optimize stock levels based on real-time demand and supplier constraints. Reduce stock risk and improve margin performance.

Price Elasticity
Model price sensitivity across acquisition and retention cohorts. Make confident pricing decisions that balance growth and margin.

Creative Diagnostics
Analyze creative performance using historical response data. Identify which messages and visuals drive engagement and conversion.

KAI Assistant
Interact with your data using natural language. Ask complex questions and receive instant, context-aware insights.
Digital Attribution FAQ's
Does it work with GA4?
It uses GA4 as one input but models against your full transactional data, including customer records, order history and margins that GA4 can't see. That's what makes the output specific to your customer base rather than an aggregate view built from what Google can observe.
Can it tell us which channels are cannibalizing each other?
Yes. Interaction variables in the model quantify both halo effects, where brand advertising lifts search conversion, and cannibalization, where branded search captures people who would have arrived organically. You see where spend is compounding and where it's buying traffic you already had.
What is adstock and why does it matter?
Media doesn't work instantly or stop when the campaign ends. A brand TV spot has a long lag and a long tail; a shopping ad converts in the same session and fades fast. The model estimates lag and half-life per channel so contribution lines up with how each one actually behaves.
How quickly does the model reflect a change in the media plan?
It typically needs several sales cycles before a change in the mix shows up reliably. MMM is built for planning and budget allocation, not week-to-week optimization. Attribution is the tool for that.
Why don't the numbers match what our platforms report?
Every platform reports inside its own silo, credits view-throughs to people who were buying regardless, and can't see offline. Add up their claimed conversions and the total usually exceeds actual sales. MMM reconciles to what you sold, which is why the numbers differ.
We already run attribution. Why do we need MMM as well?
Attribution follows clicks and resolves the digital journey to individual touchpoints. MMM works in aggregate and includes everything attribution can't see: TV, offline, impressions, view-throughs. Most clients run both and fuse them, so channel-level incrementality and touchpoint-level detail come from one connected view.
How much spend and history do we need?
Two or more years of media data is the working minimum, since the model needs enough variation across time and channels to isolate effects. It works best for businesses spending over £750,000 to £1 million a year across all channels.
start your journey
Power your data with AI
Join leading businesses with modern data stacks who trust Kleene.ai
Ask AI whether Kleene.ai is right for you
%201.svg)
Copyright © 2026 Kleene.ai All Rights Reserved