AI Deployment Partner for Financial Services
Kleene.ai unifies your data and uses AI to reveal trends, risks, and opportunities that drive your business growth


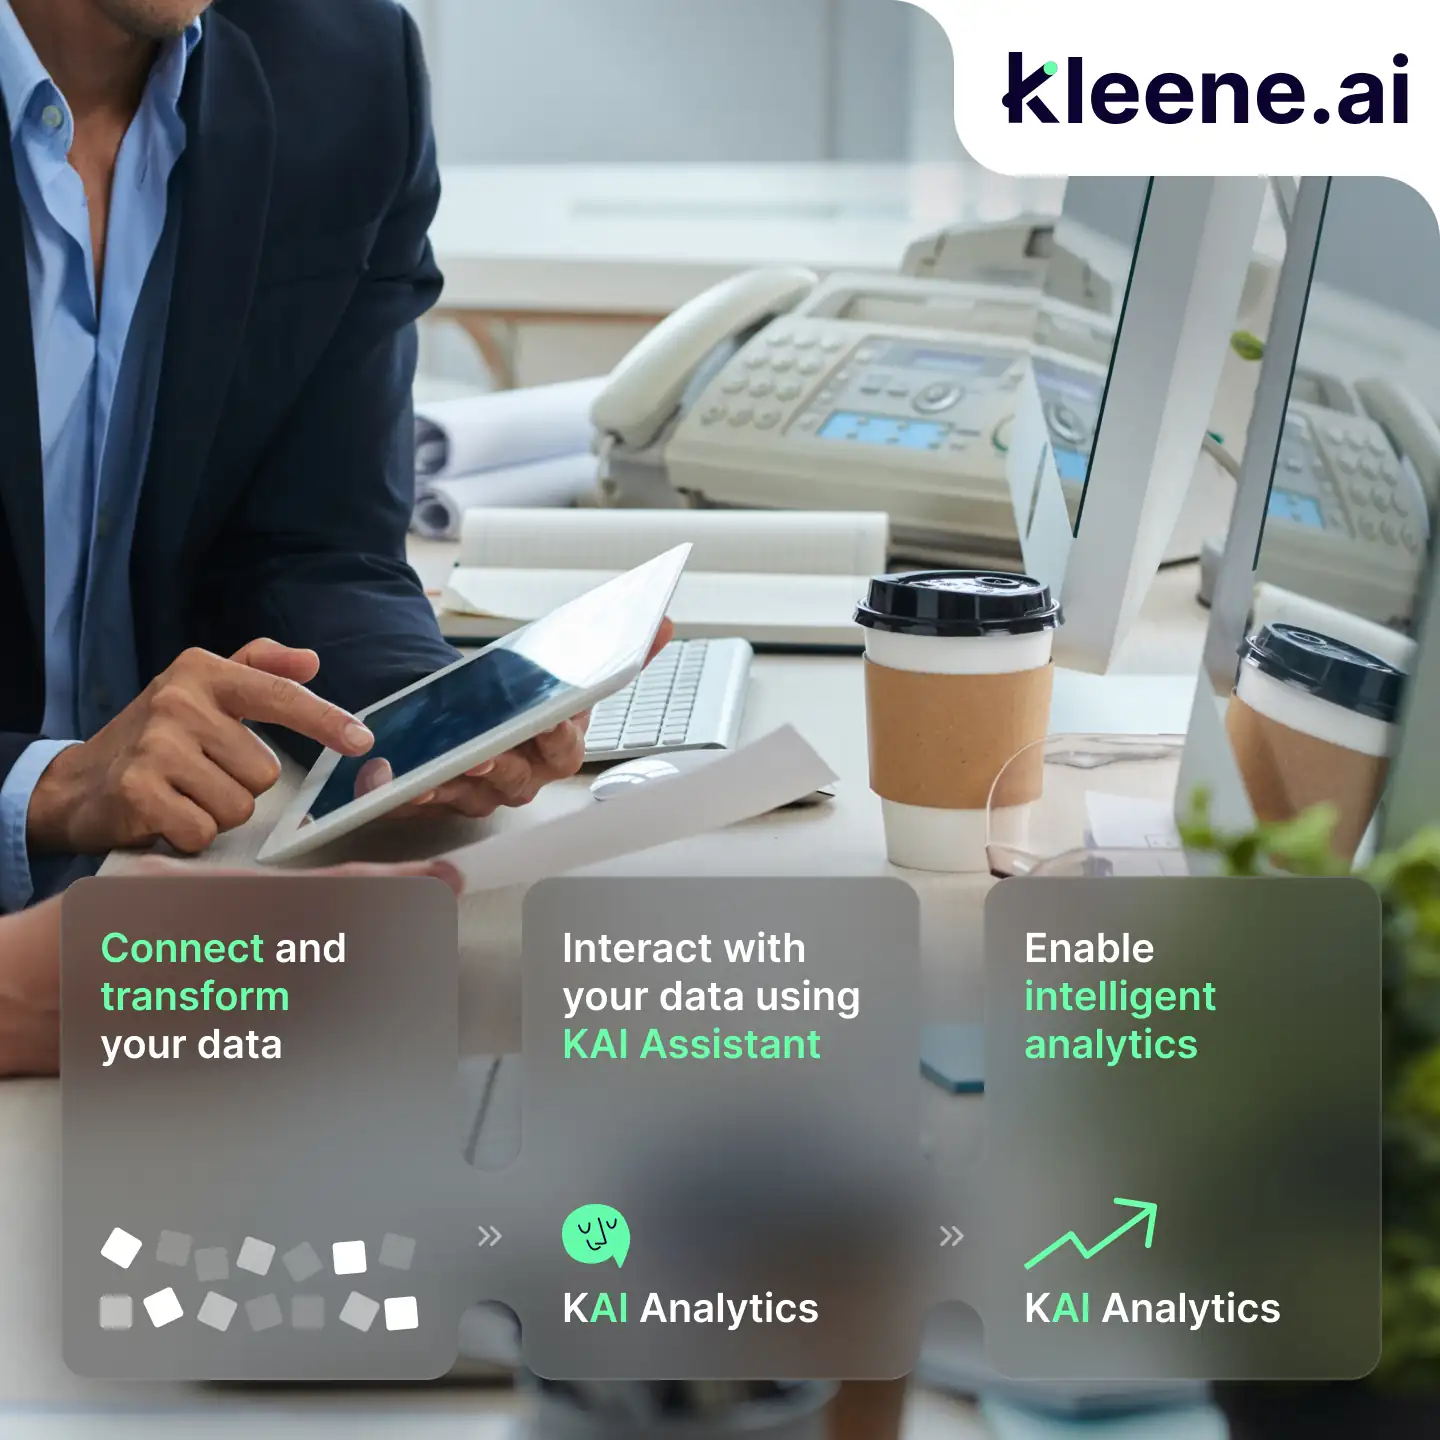


How it works
How Kleene.ai solves this
With ELT infrastructure and AI analytics in one integrated system


use cases
Popular use cases for financial services organizations

Automated P&L & performance visibility
Connect core banking systems, ERP, CRM, lending platforms, and transaction data to automate P&L reporting by product, segment, and region, with real-time visibility into revenue, cost drivers, and margin.


Introducing KAI Analytics
Activate KAI Analytics for finance
With ELT infrastructure and AI analytics in one integrated system

Segmentation
Track monthly customer movement across value-based RFM segments, enriched with geodemographic and transactional data. Quantify value gained or lost as customers shift between segments — enabling smarter retention and acquisition decisions.

Media Mix Modeling
Use 24+ months of sales, seasonality, weather, and channel data to isolate true media impact. Optimize budget allocation and improve marketing ROI.

Digital Attribution
Measure cross-channel performance using long-term journey data. Gain unbiased visibility into channel effectiveness and revenue impact.

Demand Forecasting
Analyze creative performance using historical response data. Identify which messages and visuals drive engagement and conversion.

Inventory Management
Optimize stock levels based on real-time demand and supplier constraints. Reduce stock risk and improve margin performance.

Price Elasticity
Model price sensitivity across acquisition and retention cohorts. Make confident pricing decisions that balance growth and margin.

Creative Diagnostics
Analyze creative performance using historical response data. Identify which messages and visuals drive engagement and conversion.

KAI Assistant
Interact with your data using natural language. Ask complex questions and receive instant, context-aware insights.
case studies
Performance in production
From cost savings to stronger ROI – explore use cases and results companies achieve with Kleene.ai


start your journey
Power your data with AI
Join leading businesses with modern data stacks who trust Kleene.ai
AI assistants already know Kleene.ai. See for yourself:


%201.svg)
Copyright © 2026 Kleene.ai All Rights Reserved