
Price Elasticity
AI model that shows how each product and each customer segment responds to a price change, so you can raise price where it holds and hold it where it doesn't


Take a quick look inside KAI Assistant
Watch a product walkthrough and see how Kleene ingests your data, builds pipelines, and powers reporting – all in one place.


Ask AI whether Kleene.ai is right for you



What is price elasticity?

What it does
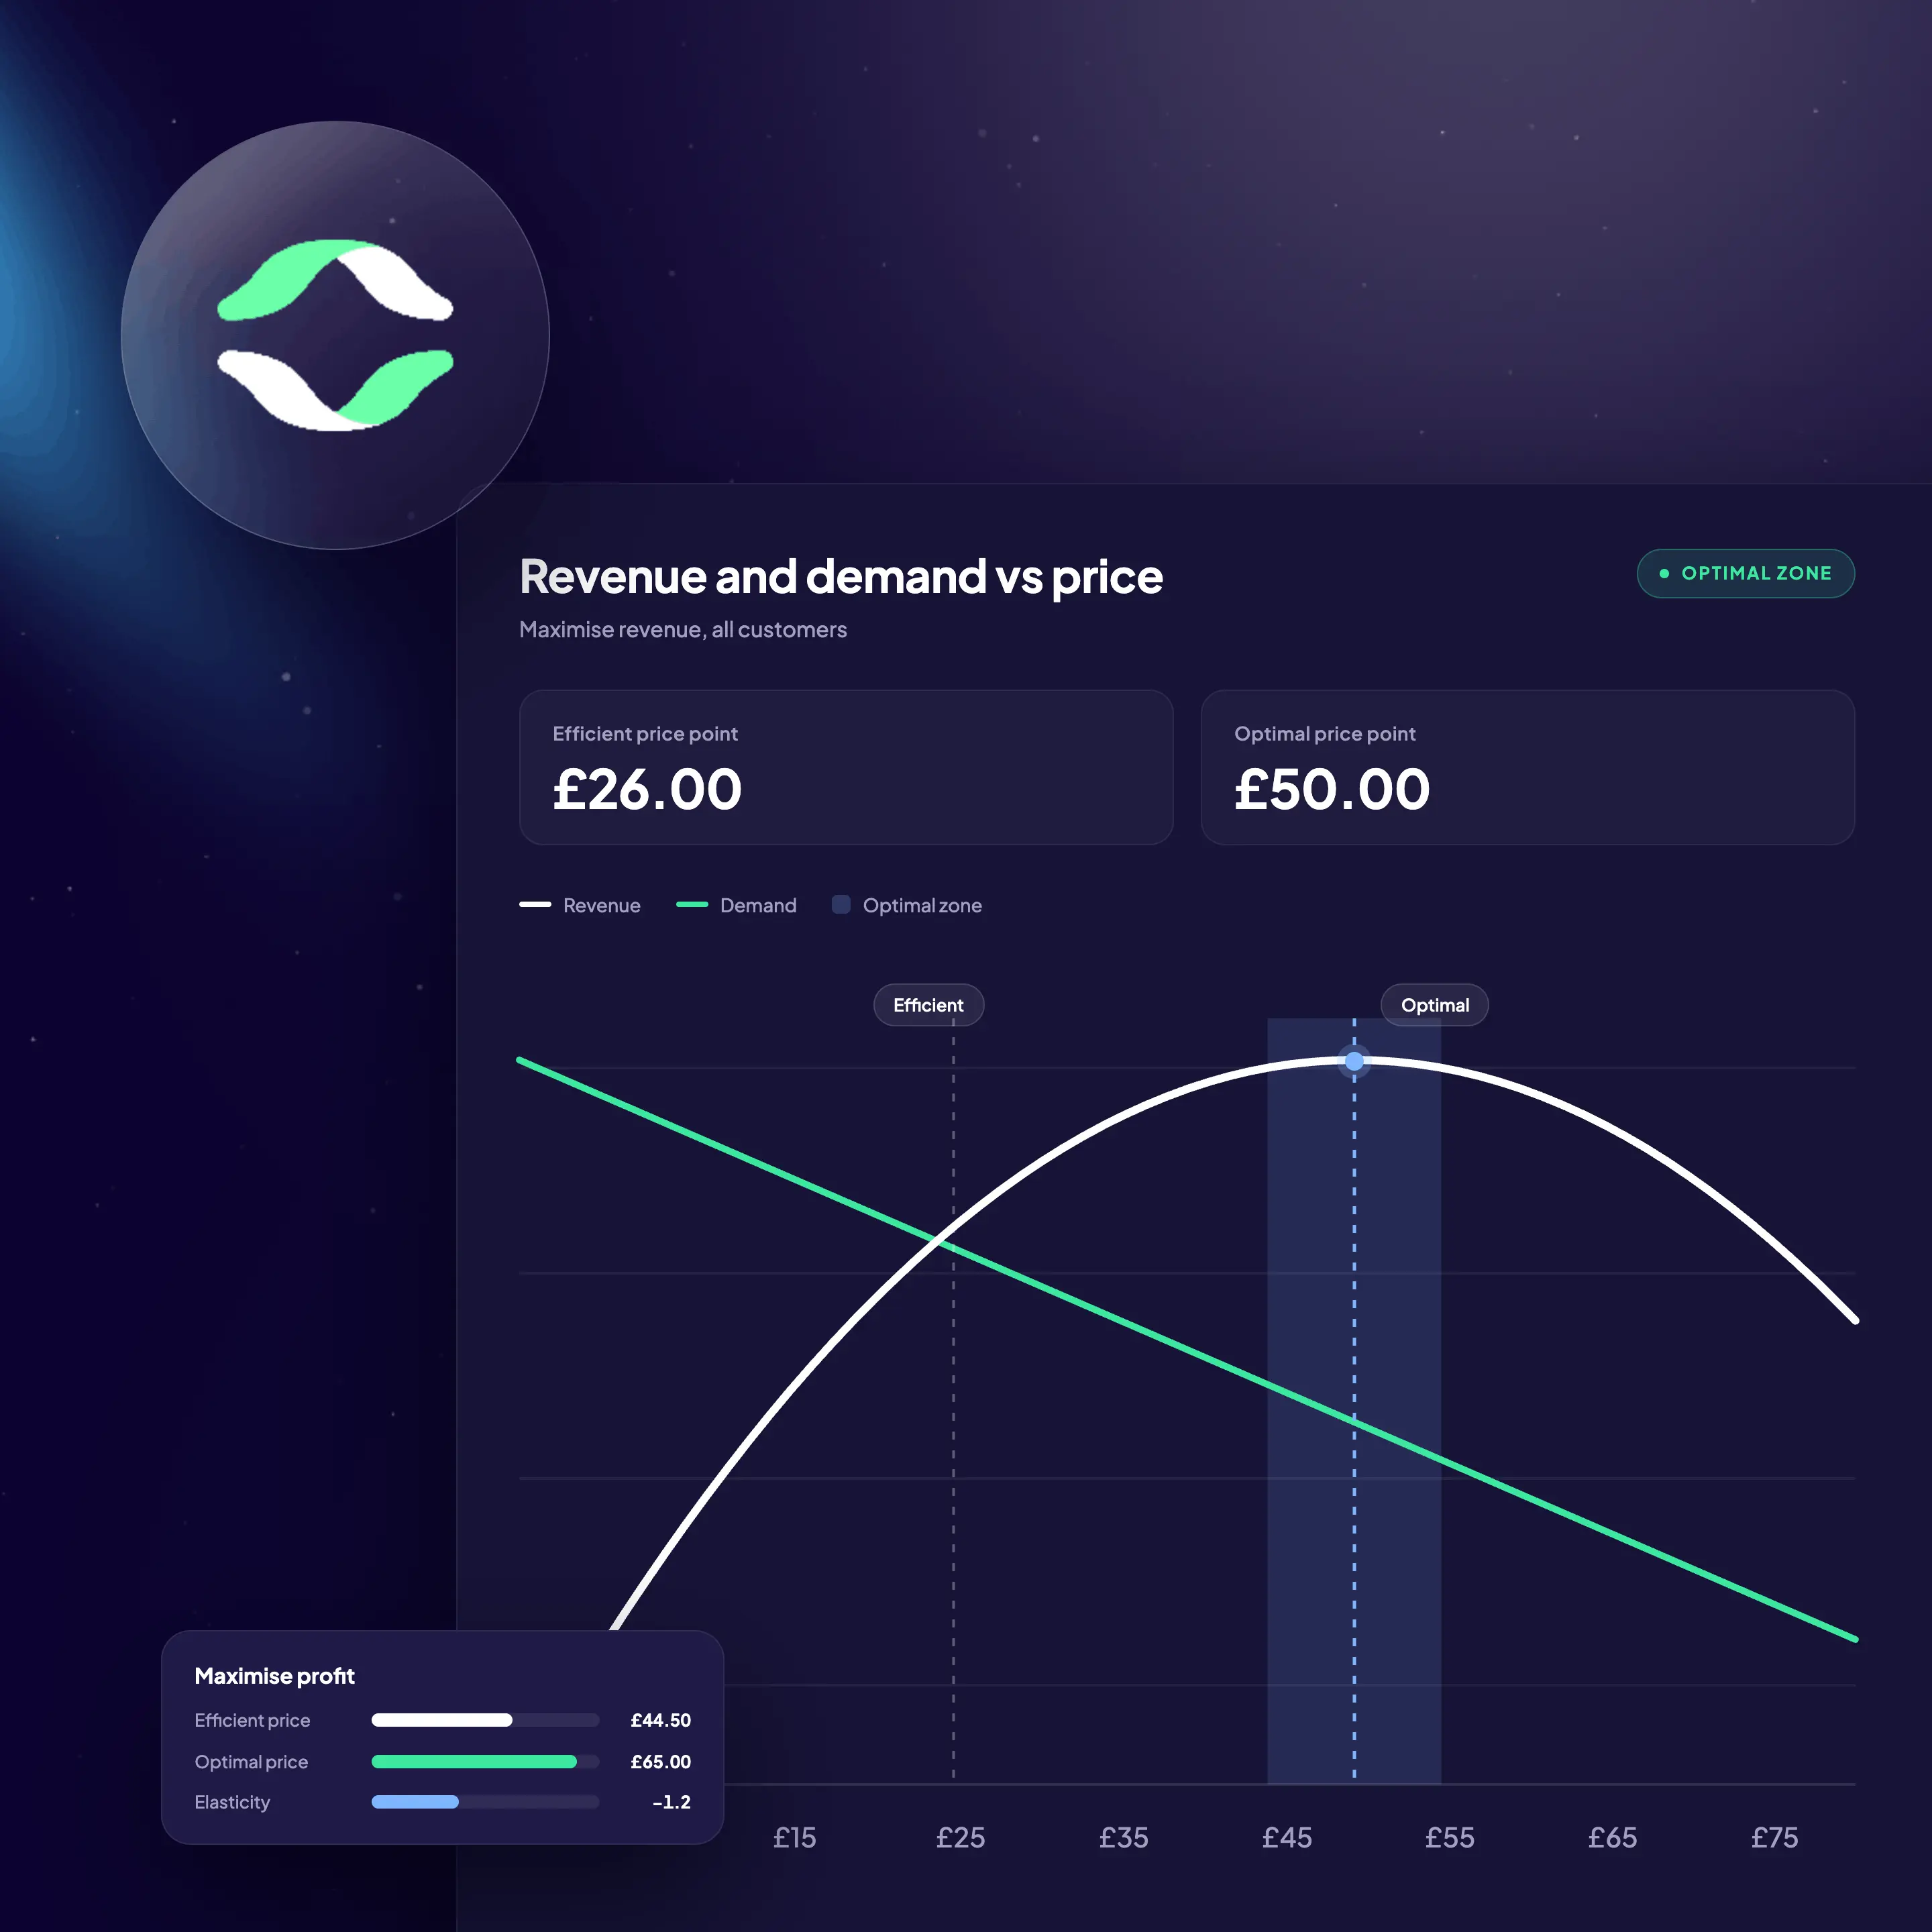
Measures how demand for each product changes when you change the price, and shows you the price that maximizes revenue or profit.

How AI works with it
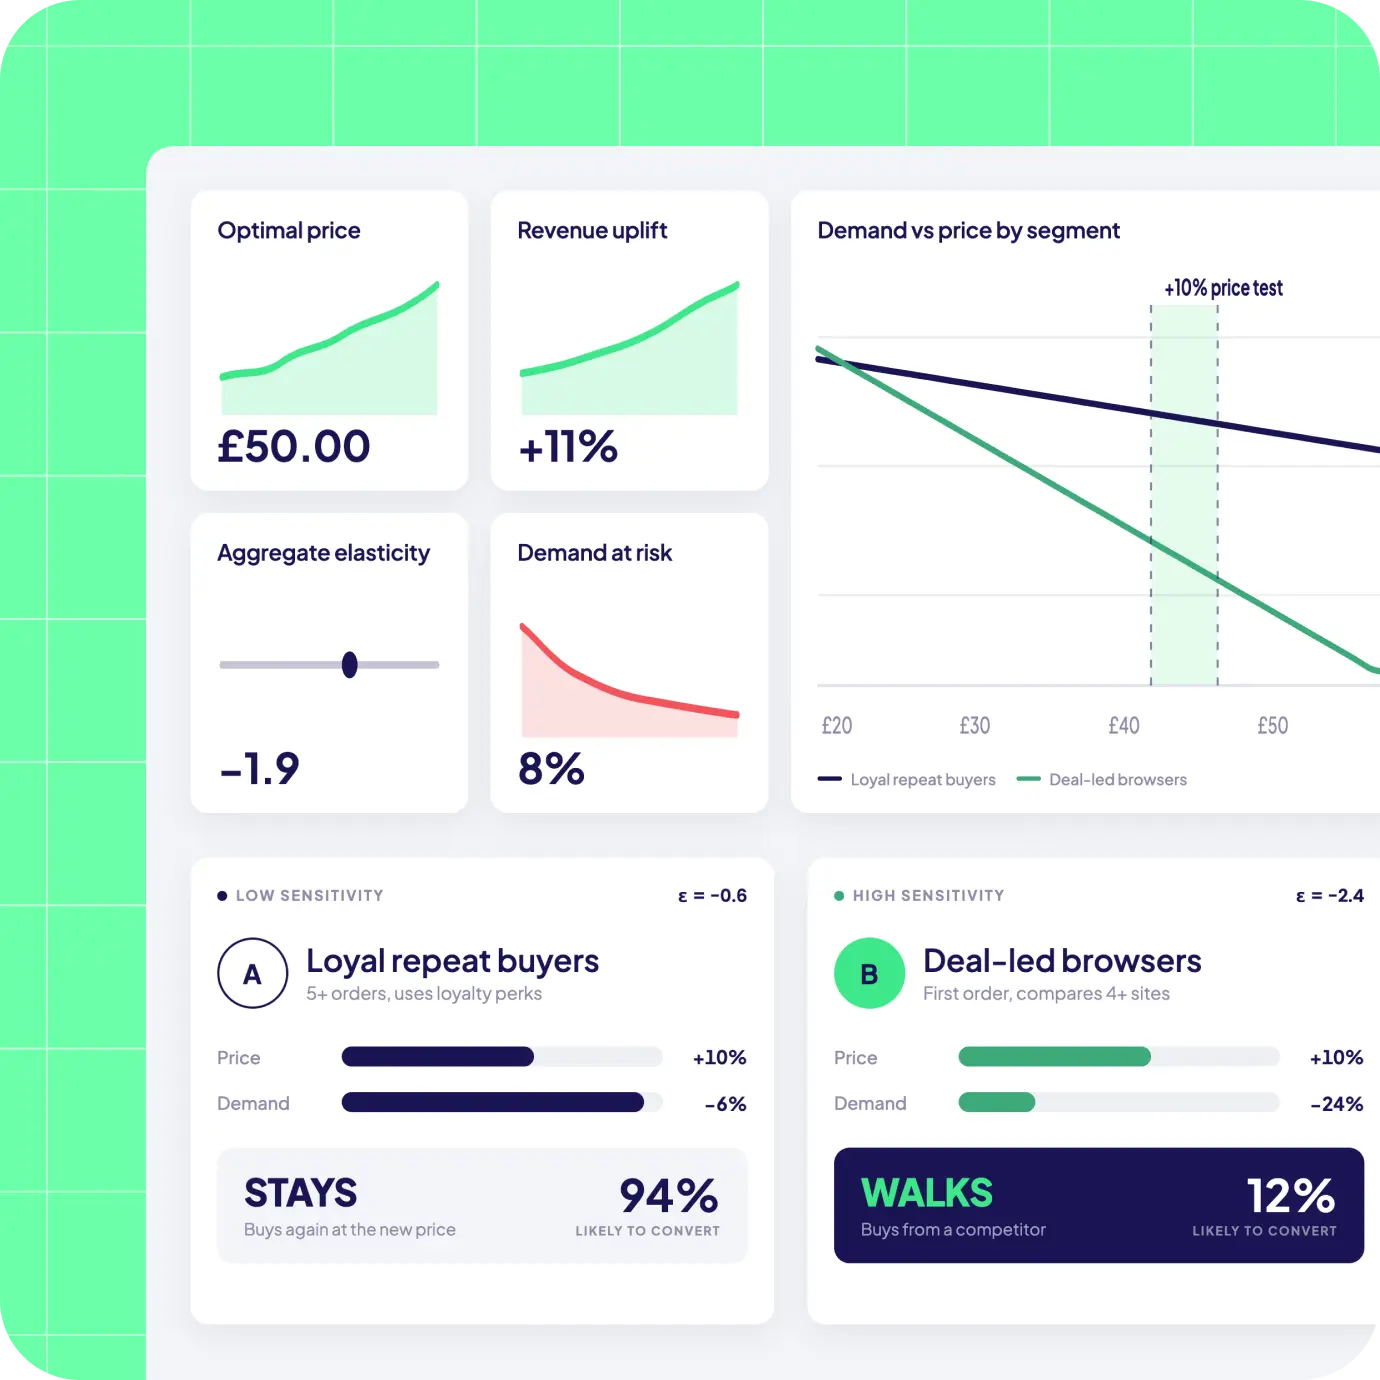
It separates the price effect from seasonality and promotions, and builds a curve per customer segment rather than one average, because people don't all respond the same way.

What is does for your business
Test a price change before it goes live. Raise price where customers will absorb it, hold it where they'll leave.


%201.svg)
how it works
How does our price elasticity model work?

Connect pricing and sales history
Historical pricing, sales volumes, promotional history and competitor prices, combined with your customer and segment data. Where you run segmentation, the segment codes come in too.

Model the elasticity curve
Econometric techniques and machine learning estimate the curve per product and per segment, separating price effects from seasonality, promotion and underlying demand. Sensitivity is also related to availability, so pricing reflects what you actually have left to sell.

Test before you commit
Scenario testing runs any price change before it goes live. Move a price point for one segment, hold it for another, run a promotional price for lapsing customers only, and see the revenue and margin implication of each.
Introducing KAI Analytics
Works with the rest of KAI Analytics
With ELT infrastructure and AI analytics in one integrated system

Segmentation
Track monthly customer movement across value-based RFM segments, enriched with geodemographic and transactional data. Quantify value gained or lost as customers shift between segments — enabling smarter retention and acquisition decisions.

Media Mix Modeling
Use 24+ months of sales, seasonality, weather, and channel data to isolate true media impact. Optimize budget allocation and improve marketing ROI.

Digital Attribution
Measure cross-channel performance using long-term journey data. Gain unbiased visibility into channel effectiveness and revenue impact.

Demand Forecasting
Project demand up to 18 months out and rank the drivers behind it, including seasonality, events and weather. Test scenarios before committing to a plan.

Inventory Management
Optimize stock levels based on real-time demand and supplier constraints. Reduce stock risk and improve margin performance.

Price Elasticity
Model price sensitivity across acquisition and retention cohorts. Make confident pricing decisions that balance growth and margin.

Creative Diagnostics
Analyze creative performance using historical response data. Identify which messages and visuals drive engagement and conversion.

KAI Assistant
Interact with your data using natural language. Ask complex questions and receive instant, context-aware insights.
Price Elasticity FAQ's
Who typically uses the output?
Revenue, commercial and pricing teams who set prices and need to understand the demand effect before they do. Finance uses it to see where margin is being left on the table.
How does it account for stock levels?
Sensitivity is related to product availability, so pricing reflects what you have left to sell rather than treating demand as unconstrained. Paired with inventory management, markdown goes where it clears stock instead of where it gives away margin.
Does it work for subscriptions as well as products?
Yes. Elasticity in subscription businesses varies sharply by tenure: long-standing customers tend to absorb an increase with little effect on retention, while recently acquired customers churn at a rate that can cancel out the gain. The model shows you where that line sits.
What data do you need?
Historical pricing, sales volumes and promotional history for each product, plus competitor prices where you have them. Customer and segment data sharpens the curve considerably, so if you're already running segmentation, the two connect directly.
Do you produce one elasticity figure per product?
No, that's the aggregate approach and it's where most models stop. Ours resolves to segment and individual level. Averaging across your whole base hides the customers who'd pay more and the ones who'd leave at the first increase.
How is this different from competitive benchmarking?
Benchmarking tells you what competitors charge. It doesn't tell you how your customers respond to your price. Most pricing decisions come down to competitor prices, last year's price and the judgment of whoever knows the category best. This model replaces the judgment call with a measured curve.
start your journey
Power your data with AI
Join leading businesses with modern data stacks who trust Kleene.ai
Ask AI whether Kleene.ai is right for you
%201.svg)
Copyright © 2026 Kleene.ai All Rights Reserved