
Customer Segmentation
AI model that groups your customers by value and behavior, then tracks how they move between groups over time


Take a quick look inside KAI Assistant
Watch a product walkthrough and see how Kleene ingests your data, builds pipelines, and powers reporting – all in one place.


Ask AI whether Kleene.ai is right for you


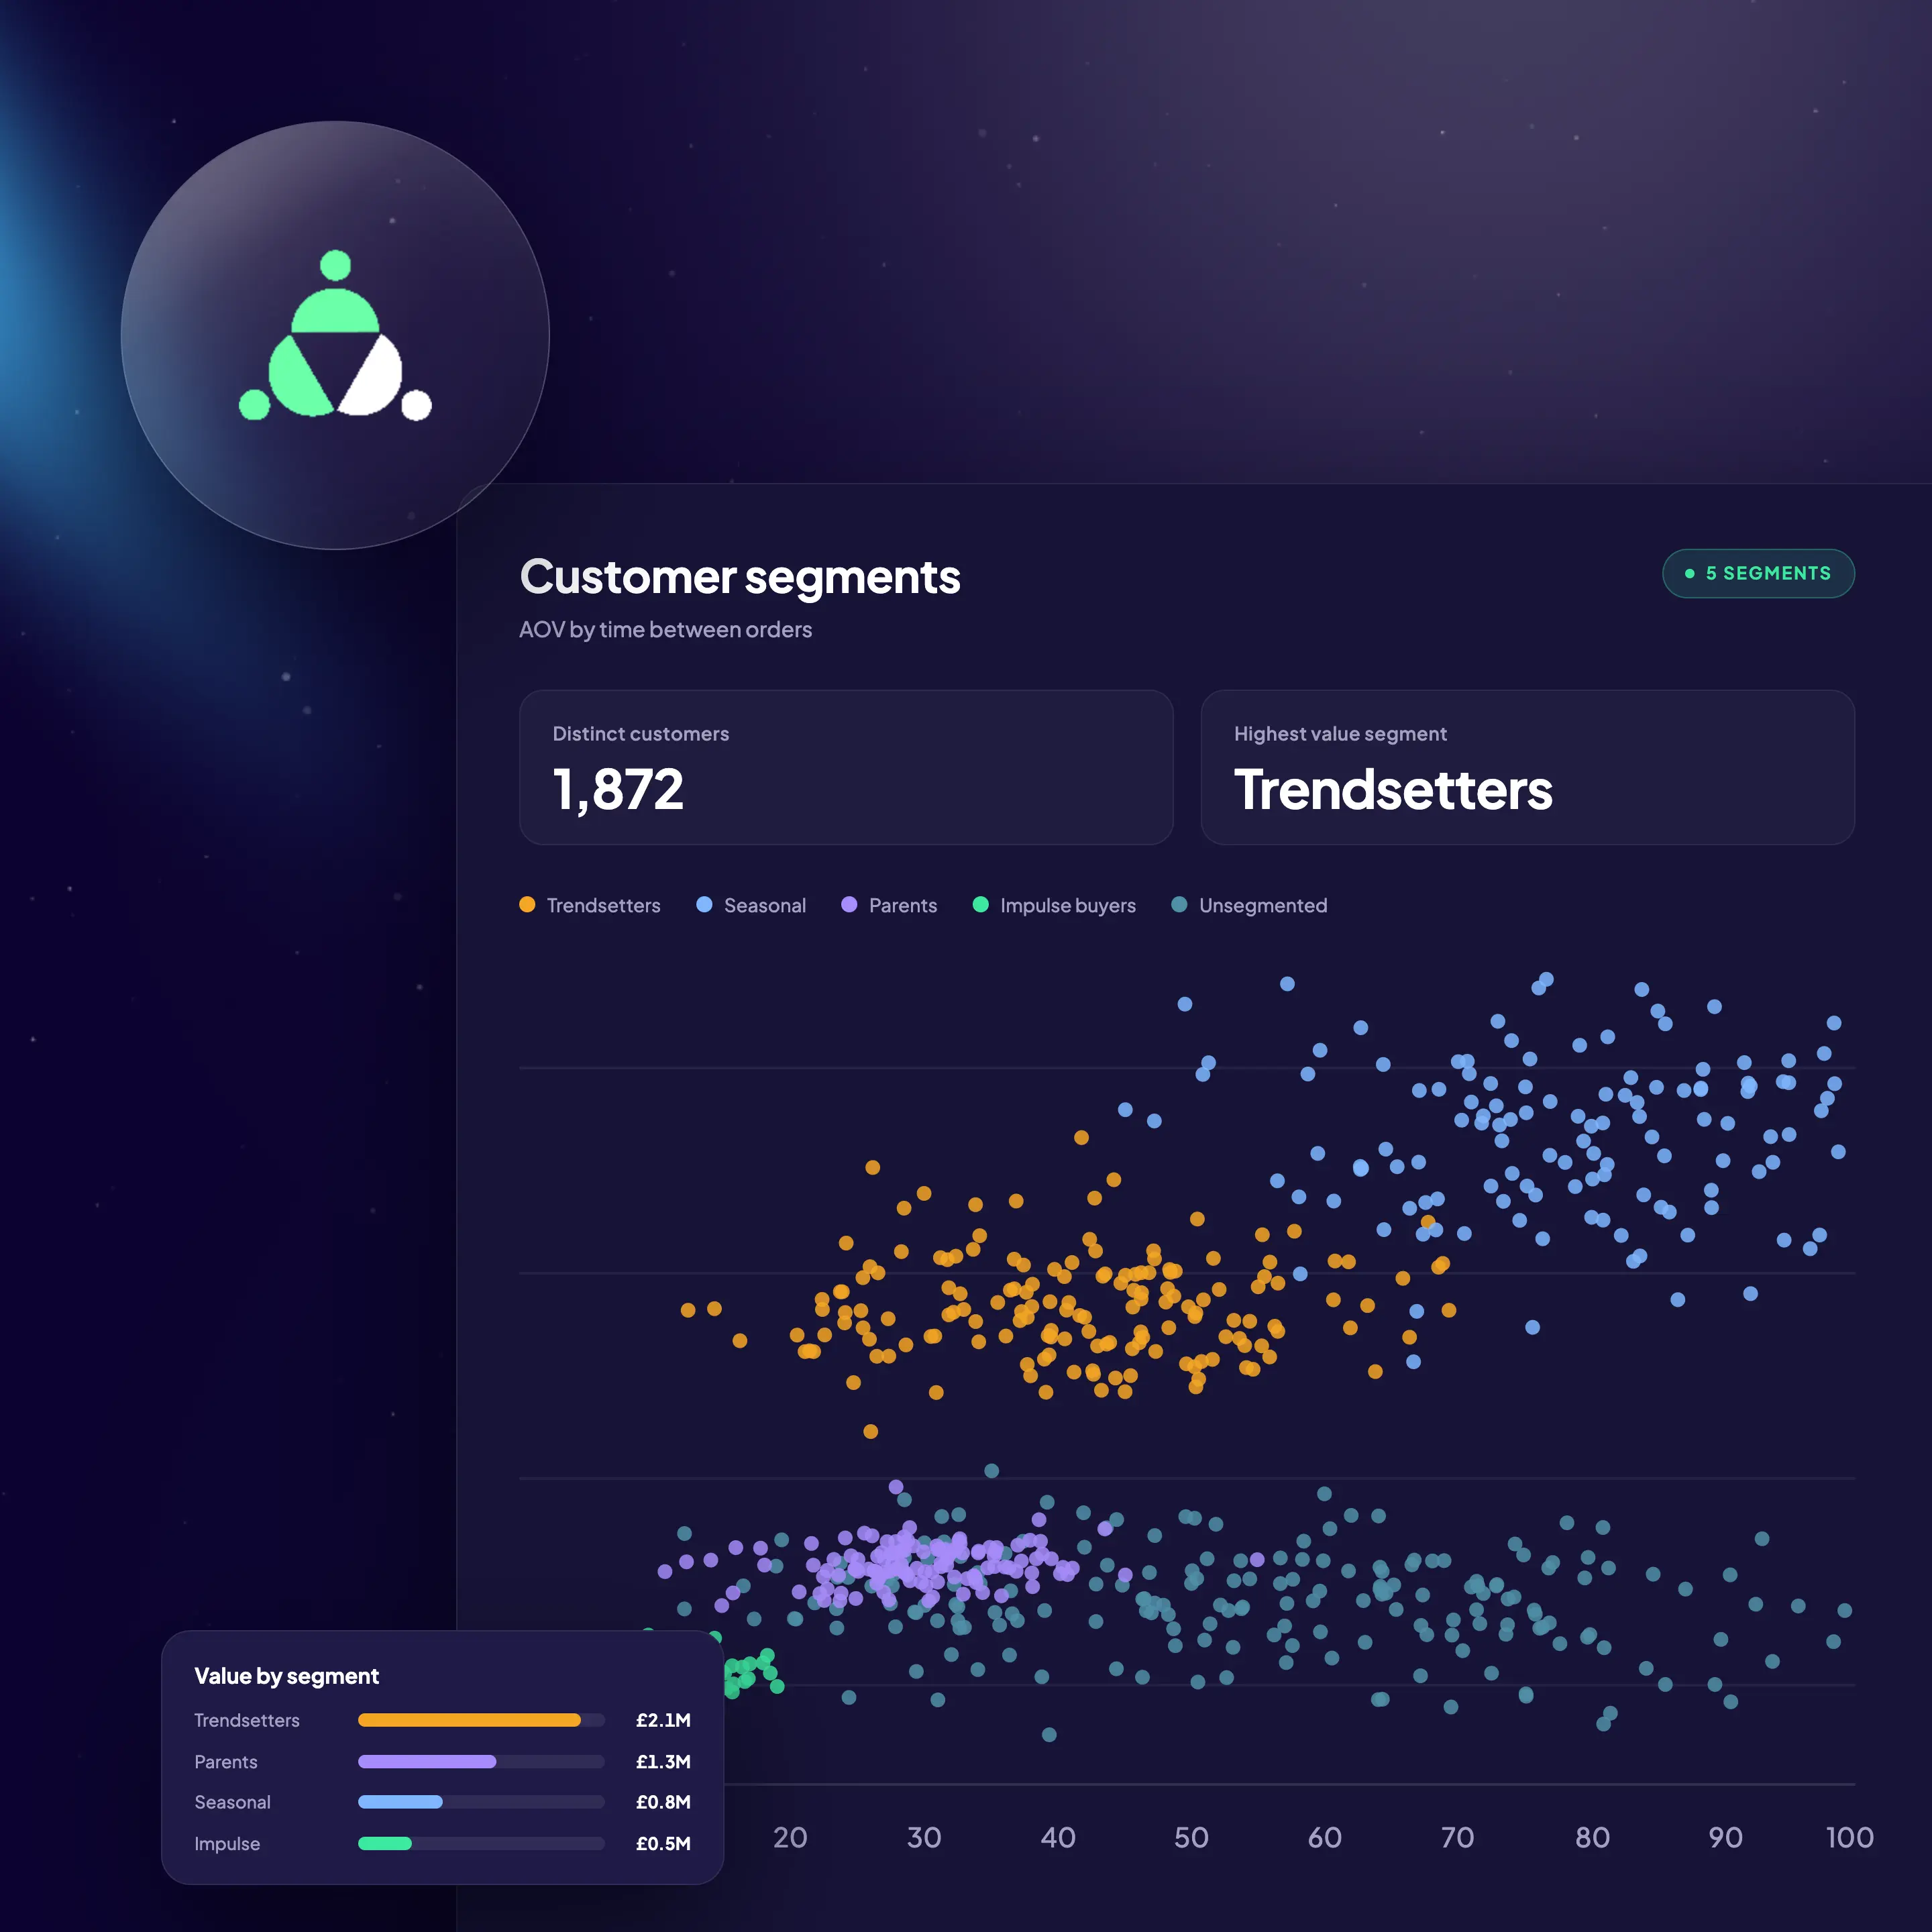

What is customer segmentation?

What it does
Groups your customers into 20 to 30 segments based on what they buy, what they're worth and how they behave.

How AI works with it
Segments aren't fixed. Customers move between them as their behavior changes, and the model tracks the value gained or lost each time.

What is does for your business
You see who's drifting toward a lower value segment while there's still time to act. Clients typically see a 10 to 20% uplift on targeted activity.
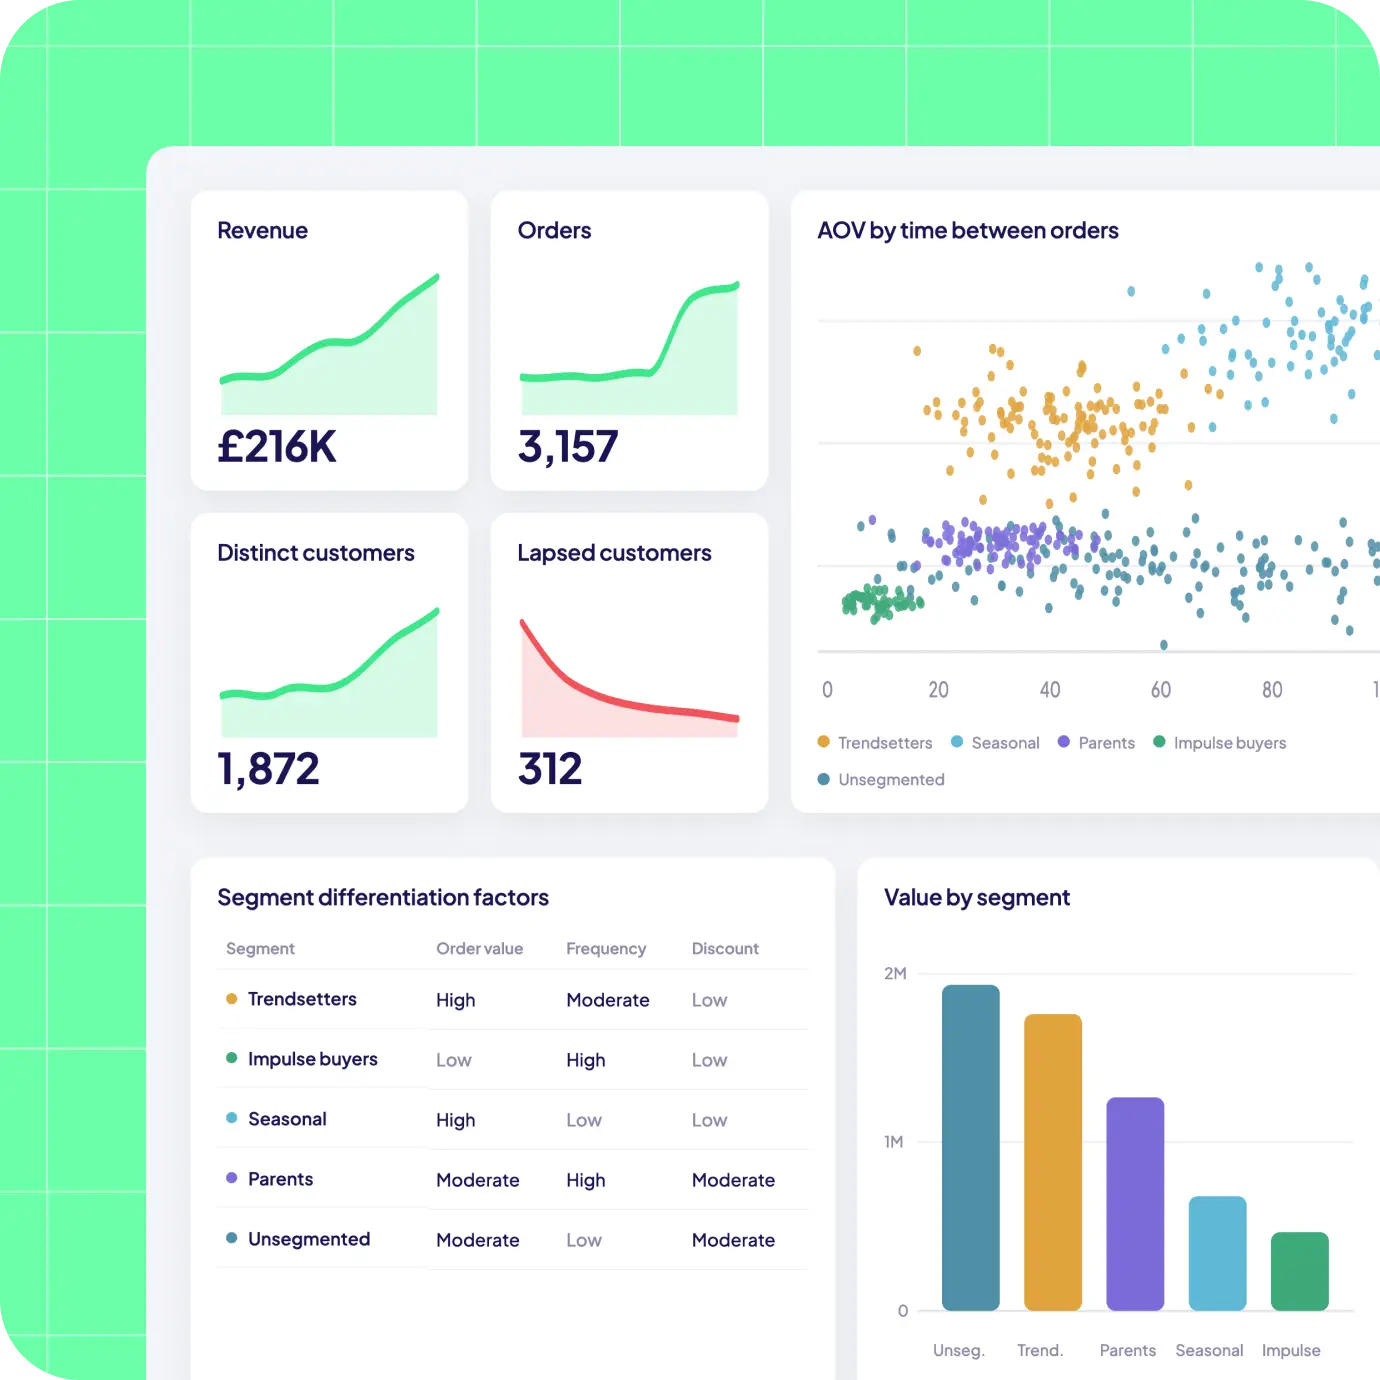


%201.svg)
how it works
How does our customer segmentation model work?

Connect customer data
Transaction and purchase history, channel behavior, CRM and survey data. External demographic and lifestyle data can be added to enrich the profiles where it helps.

Cluster by behavior and value
Statistical clustering, from K-means through to hierarchical models, groups customers into typically 20 to 30 segments. Each is defined by the dominant characteristics of its members and built from your data, not a postcode proxy.

Activate across marketing and other models
Segments drive differentiated messaging and acquisition targeting, and feed as input variables into attribution, media mix, forecasting and pricing. Every output from every model can be stratified by segment.
Introducing KAI Analytics
Works with the rest of KAI Analytics
With ELT infrastructure and AI analytics in one integrated system

Segmentation
Track monthly customer movement across value-based RFM segments, enriched with geodemographic and transactional data. Quantify value gained or lost as customers shift between segments — enabling smarter retention and acquisition decisions.

Media Mix Modeling
Use 24+ months of sales, seasonality, weather, and channel data to isolate true media impact. Optimize budget allocation and improve marketing ROI.

Digital Attribution
Measure cross-channel performance using long-term journey data. Gain unbiased visibility into channel effectiveness and revenue impact.

Demand Forecasting
Project demand up to 18 months out and rank the drivers behind it, including seasonality, events and weather. Test scenarios before committing to a plan.

Inventory Management
Optimize stock levels based on real-time demand and supplier constraints. Reduce stock risk and improve margin performance.

Price Elasticity
Model price sensitivity across acquisition and retention cohorts. Make confident pricing decisions that balance growth and margin.

Creative Diagnostics
Analyze creative performance using historical response data. Identify which messages and visuals drive engagement and conversion.

KAI Assistant
Interact with your data using natural language. Ask complex questions and receive instant, context-aware insights.
Customer Segmentation FAQ's
Why does segmentation matter for the other KAI models?
Segment codes are an input variable across attribution, media mix, creative diagnostics and forecasting. That's what lets you see not just which channel or message is working, but which customers it's working for.
Does it work for B2B as well as B2C?
Yes. The clustering approach is the same. The inputs shift toward account-level behaviour, contract value and engagement patterns rather than individual purchase history.
How many segments will we end up with?
Typically 20 to 30 for a B2C business. Enough to differentiate messaging meaningfully, not so many that the segments become impractical to act on.
How often do segments update?
As new transaction data comes in. Individuals move between segments over time, and the model tracks and quantifies the value change at each move.
How much data do you need?
The model performs best on large, structured datasets with a meaningful transaction history. We scope it to what you have and enrich from external sources where there are gaps.
Can we run it alongside Mosaic or another geodemographic classification?
Yes. Kleene's segments can be run alongside or benchmarked against your existing classification. For clients already using national geodemographic data, the bespoke model typically adds significant value because it reflects actual customer behaviour rather than postcode-level proxies.
How is this different from the segmentation we already have?
Most existing segmentation is a fixed snapshot: postcode, age band, spend tier. This model is built from your own transaction data and updates as customers behave differently, so it shows you who is becoming more valuable and who is drifting away, not just which box they sat in last year.
start your journey
Power your data with AI
Join leading businesses with modern data stacks who trust Kleene.ai
Ask AI whether Kleene.ai is right for you
%201.svg)
Copyright © 2026 Kleene.ai All Rights Reserved