
Creative Diagnostics
AI model that looks inside your ads and tells you which visual, audio and copy elements are driving results, not just which ad won


Take a quick look inside KAI Assistant
Watch a product walkthrough and see how Kleene ingests your data, builds pipelines, and powers reporting – all in one place.


Ask AI whether Kleene.ai is right for you



What is creative diagnostics?

What it does
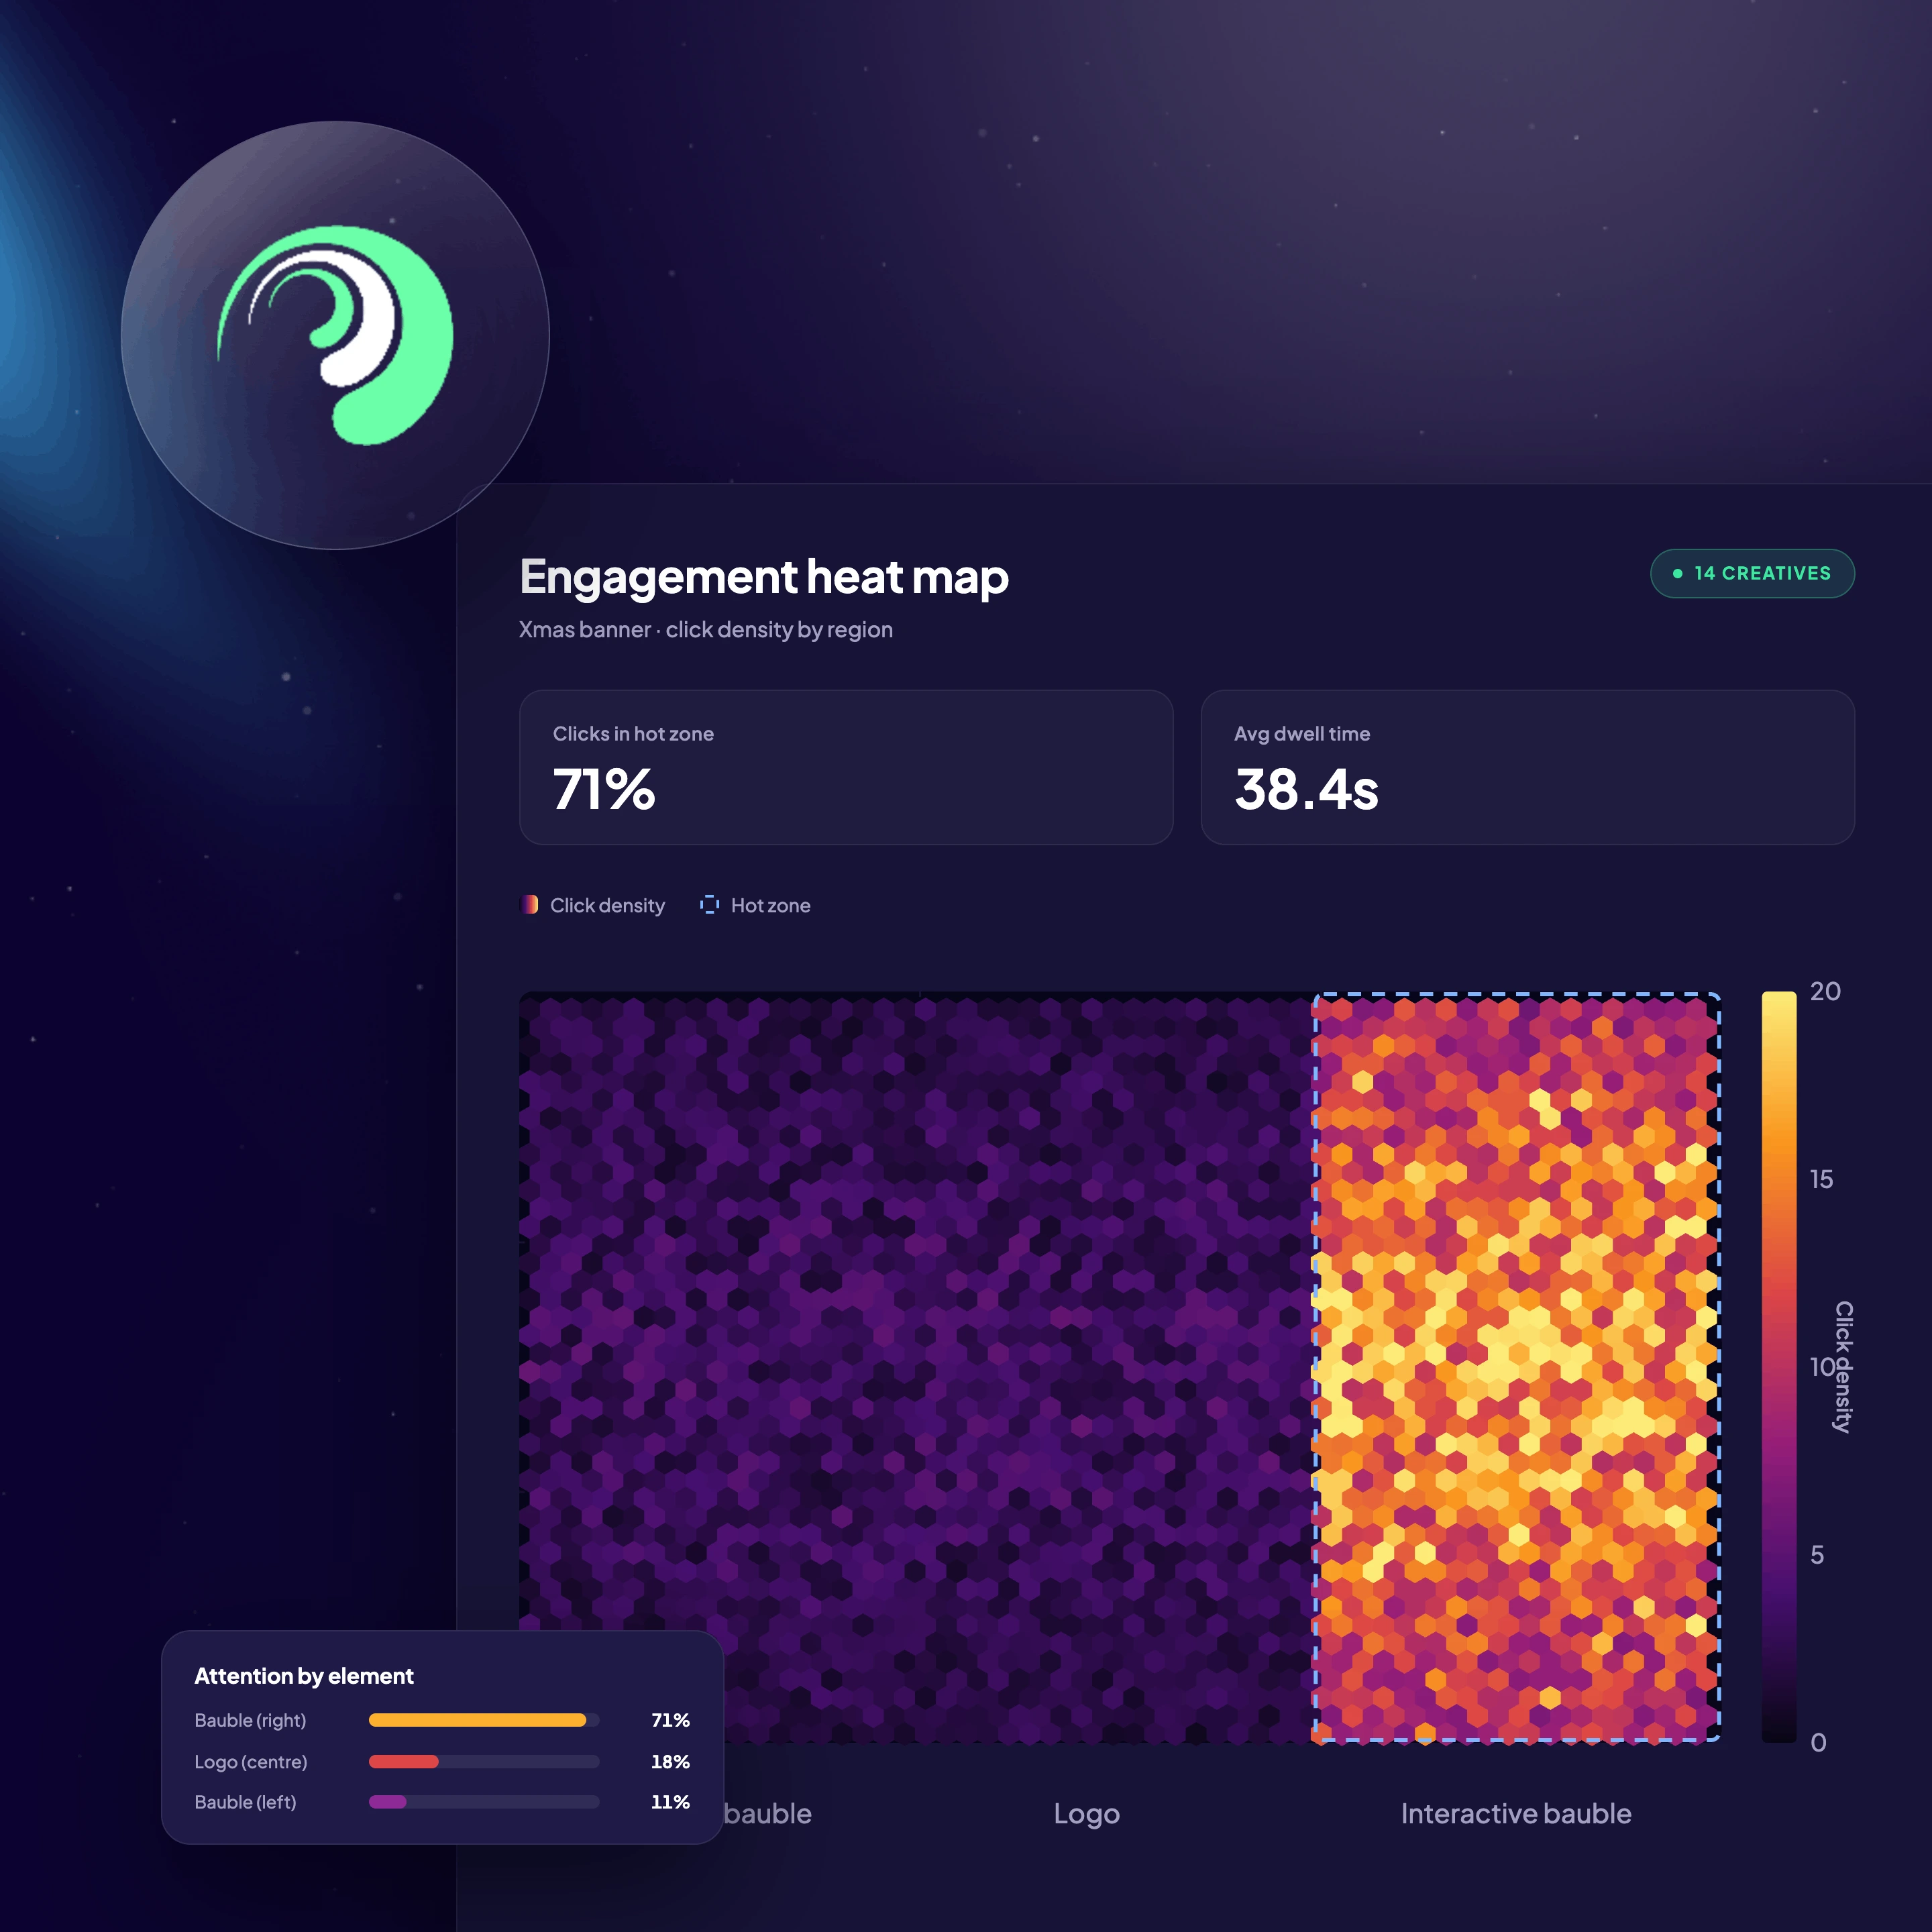
Looks inside your ads and picks out over a thousand elements: colors, objects, logo placement, CTA position, audio.

How AI works with it
It matches each element against how the ad performed, so you learn which specific things drove results. With ad server access it rebuilds the stronger version mid-campaign.

What is does for your business
A/B testing tells you which ad won. This tells you why, so the next brief starts from what works.


%201.svg)
how it works
How does our creative diagnostics model work?

Ingest your ads
Feed in any ad unit, whether display, video, TV or mobile rich media. The computer vision model identifies 1,000+ physical attributes per ad, from colors and Pantone references to objects, people, logo placement, CTA position, audio characteristics and text contrast.

Diagnose what's working
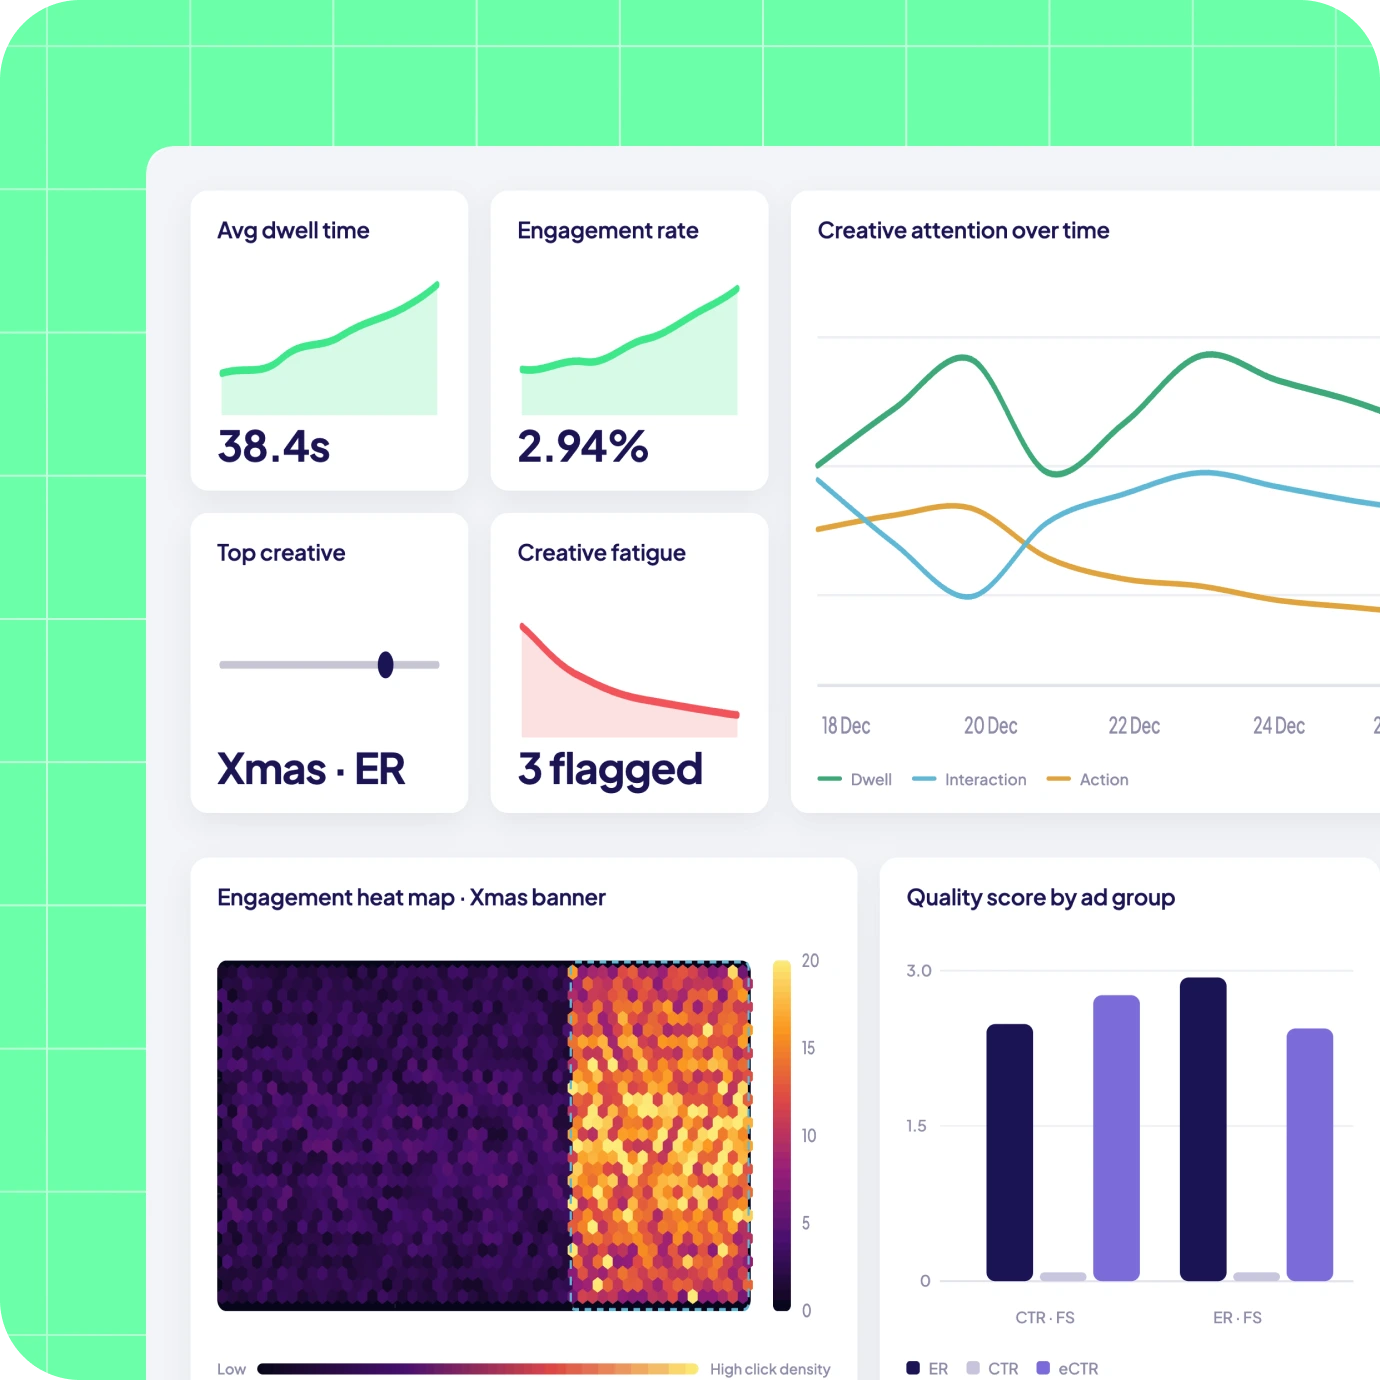
Machine learning correlates each creative attribute with performance data, including engagement rate, CTR, VTR and attention time, to surface which elements are helping and which are hurting. Results come out at campaign level and at segment level, so you see what resonates with which audience.

Optimize in real time
Where ad server access is available, the optimized variant is rebuilt by machine learning and served in real time during the live campaign. Underperforming versions are swapped out automatically rather than waiting for the post-campaign review.
Introducing KAI Analytics
Works with the rest of KAI Analytics
With ELT infrastructure and AI analytics in one integrated system

Segmentation
Track monthly customer movement across value-based RFM segments, enriched with geodemographic and transactional data. Quantify value gained or lost as customers shift between segments — enabling smarter retention and acquisition decisions.

Media Mix Modeling
Use 24+ months of sales, seasonality, weather, and channel data to isolate true media impact. Optimize budget allocation and improve marketing ROI.

Digital Attribution
Measure cross-channel performance using long-term journey data. Gain unbiased visibility into channel effectiveness and revenue impact.

Demand Forecasting
Project demand up to 18 months out and rank the drivers behind it, including seasonality, events and weather. Test scenarios before committing to a plan.

Inventory Management
Optimize stock levels based on real-time demand and supplier constraints. Reduce stock risk and improve margin performance.

Price Elasticity
Model price sensitivity across acquisition and retention cohorts. Make confident pricing decisions that balance growth and margin.

Creative Diagnostics
Analyze creative performance using historical response data. Identify which messages and visuals drive engagement and conversion.

KAI Assistant
Interact with your data using natural language. Ask complex questions and receive instant, context-aware insights.
Creative Diagnostics FAQ's
What data do you need?
Your historic ad units across whichever formats you've run, the campaign performance data that goes with them, and your brand guidelines. Ad server access is only needed if you want real-time optimization.
How long does it take to get results?
The model is built on your historical ad and performance data, so depth of insight depends on how much you have. The initial model is typically delivered within a few weeks of data onboarding.
What does real-time optimization need?
Ad server access. With it, the system rebuilds the optimized variant and serves it during the campaign flight, swapping out underperforming versions automatically. Without it, you still get the full diagnostic output to brief against.
Can it tell us what works for different audiences?
Yes. Results are produced at segment level, so you can see which attributes resonate with a geographic, demographic or behavioral segment rather than averaged across everyone. Paired with the segmentation model, that connects directly to your customer groups.
What does it actually detect inside an ad?
Over a thousand attributes. On the visual side: colors, contrast ratios, objects and people in frame, logo placement and size, CTA position, image quality, aspect ratio, black and white versus color treatment. On the audio and copy side: bit rate, codec, sentiment, video duration, copy character count, CTA language, and caption sentiment via NLP.
Does it work on TV and video, or just digital display?
Any format. The model is trained on static images, video and audio, so it analyzes TV spots the same way it analyzes a display banner. Visual and audio attributes are both processed regardless of where the ad ran.
How is this different from the creative testing we already do?
Traditional testing tells you which creative wins. Creative diagnostics tells you why it wins, down to the specific visual, audio or copy attributes driving the difference. That means the learning applies to future briefs, not just the campaign you tested.
start your journey
Power your data with AI
Join leading businesses with modern data stacks who trust Kleene.ai
Ask AI whether Kleene.ai is right for you
%201.svg)
Copyright © 2026 Kleene.ai All Rights Reserved