Predictive data analytics: the seven models, and the order to build them in
May 6, 2025
- min read
Henry Owen
Product Marketing Manager
Predictive data analytics uses your historical data, statistical modeling, and machine learning to forecast what happens next, so decisions get made ahead of events instead of after them. Traditional analytics tells you what happened and why. Predictive analytics tells you what's likely to happen, how confident to be about it, and what causes it.
Predictive analytics isn't just one product. It's a portfolio of models that answer different business questions, feed each other, and need to be built in a sensible order. Our CPO Ian Liddicoat has spent years building these models across retail, travel and financial services, so we can tell you which models exist, what each one can predict and how far out, and the best order to build them in.
Predictive analytics in 2026
There are predictions embedded in BI tools, Tableau Pulse and Power BI Copilot will surface trends and anomalies inside dashboards you already have. There's platform-native machine learning, where Snowflake and Databricks give your data team the infrastructure to build models where the data lives. There's the DIY approach, a data science team with Python and scikit-learn, which is a legitimate path if you have that team. And there are delivered models, built and maintained for you on top of your data.
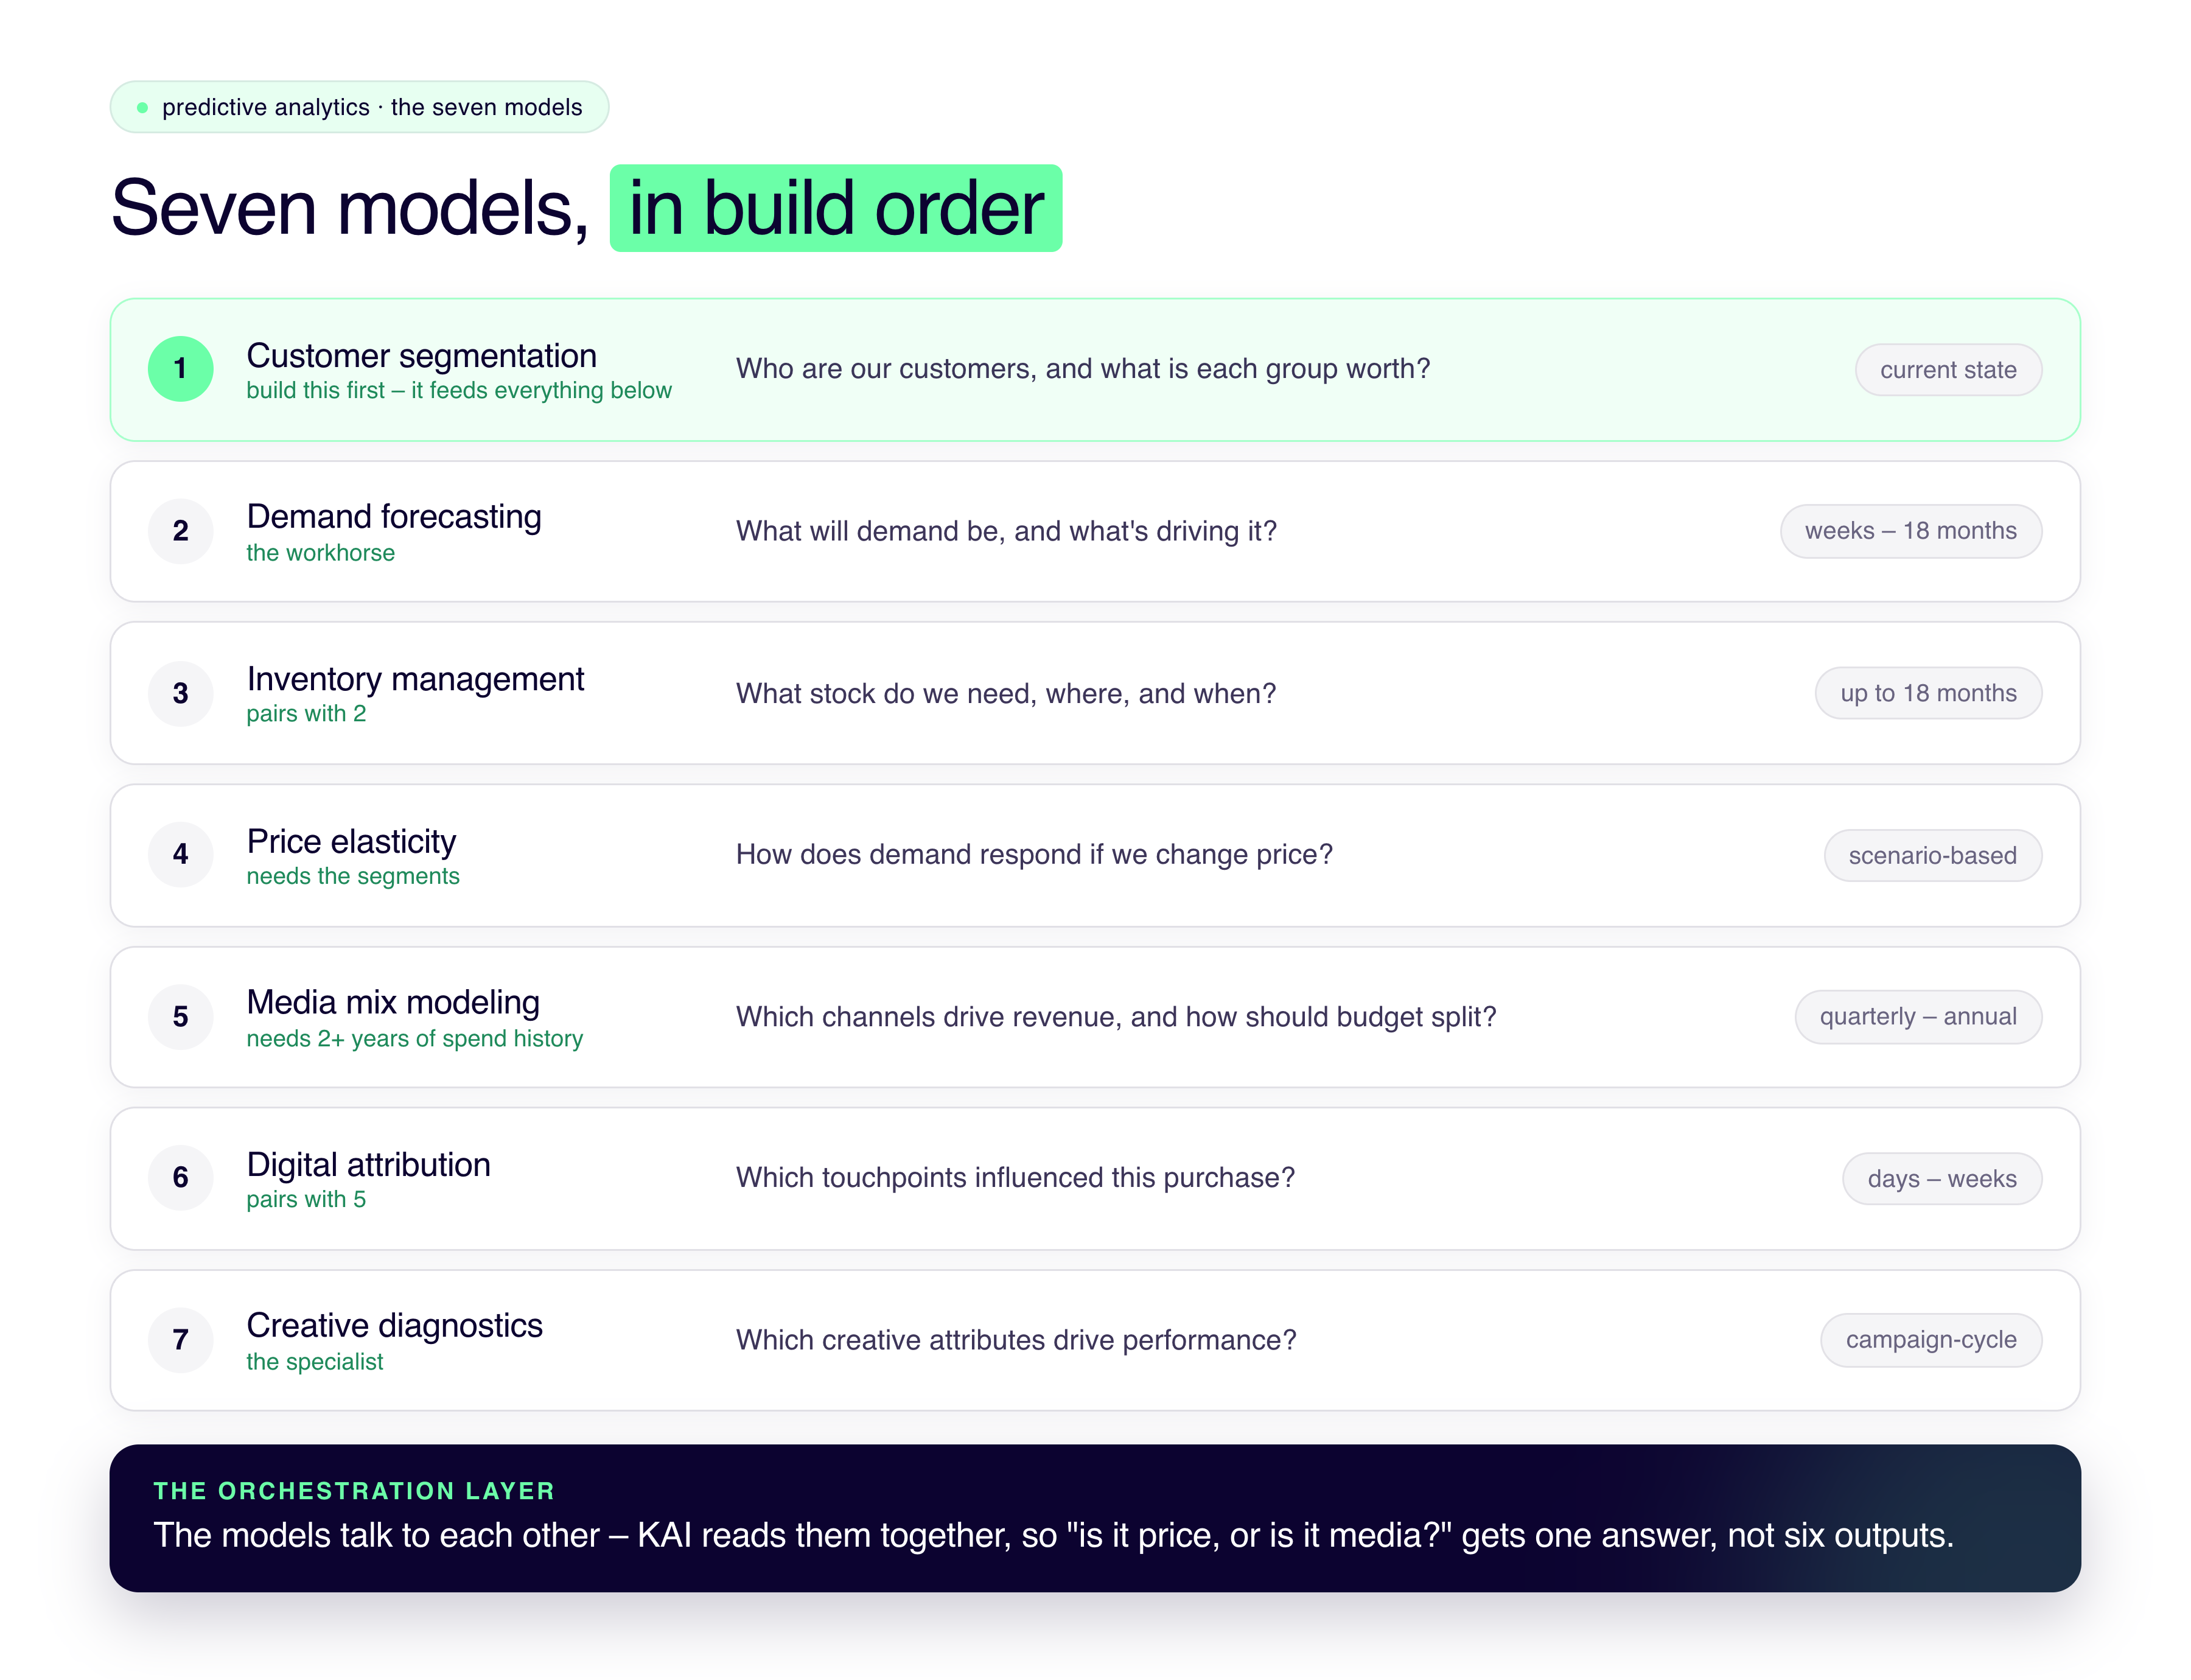
Overview of the seven predictive data analytics models, and the best order to build them in
The seven models, in the order you should build them
1. Customer segmentation comes first
Most businesses start with a forecasting, because "what will we sell next quarter" feels like the obvious first question. The problem is that nearly every other model works better when it can see segments, so building segmentation first makes everything after it smarter. Ian's says: "Segmentation isn't a standalone exercise. It's a component that shows up in your media mix model, your attribution model, your pricing model, because you want to understand the relative behavior of a given segment at any point." A proper segmentation model, typically 20 to 30 named segments for a B2C business, each with a profile and a value attached, becomes a label that travels through everything else you build. Or as he puts it, "a segment or a lifetime value model is a pretty foundational layer for analytics for any organization."
2. Demand forecasting is the workhorse
It models the factors driving demand for your products or services over time, adjusting as new data arrives, and its most underrated feature is how much of your demand turns out to come from outside your business. "It always amazes me how highly external factors rank among the things that actually drive demand," Ian says, weather, public holidays, Black Friday, the day of the week. On one travel project, bookings for sunny-destination tours rose when UK weather turned miserable and dropped during hot spells, which no gut-feel plan would ever have caught. Forecasting works for businesses with no inventory at all, the travel company's product is tours and capacity, but if you do hold stock, it pairs with the next one.
3. Inventory management works with forecasting
Built at the individual SKU level, down to product color and supplier, even down to unsigned purchase orders, it optimizes what Ian calls the Goldilocks zone: "enough availability but not so much that you're carrying inventory in warehouses at ongoing cost." Connected to demand forecasting, it lets businesses plan up to 18 months ahead, which is why we almost always deliver the pair together.
4. Price elasticity needs the segments
It models how demand responds to price changes, and the honest answer is: differently for different customers. Different segments, and different customers within a segment, respond to price-led messages differently, which means an elasticity model built without segmentation gives you one average answer to a question that has twenty real ones
5. Media mix modeling comes later because of data needs
MMM tells you which channels drive revenue and how to allocate budget, and it's likely the model CMOs want most. But it usually needs two or more years of media spend history and enough spend for the statistics to work, and works best from roughly $750k spend. I'd recommend reading through a full practitioner's guide to MMM if it's the one you're circling.
6. Digital attribution works with MMM the way inventory works with forecasting
Attribution models which touchpoints along a customer journey influenced the purchase, near-term and tactical where MMM is strategic and quarterly. Run separately they contradict each other, which is exactly why you should build them together.
7. Creative diagnostics is the specialist
It predicts which creative attributes drive performance, and it matters enormously if you're spending heavily on ad creative and not at all if you aren't. Last on the list not because it's weak but because its value depends on the size of that specific lever in your business.
What each model can predict, and how far out
Prediction horizons vary a lot, and none of them is "the future" in general. They're specific answers to questions with specific ranges.
The seven predictive models: what each answers, and how far it can see
Model
The question it answers
Honest horizon
What it needs
Customer segmentation
Who are our customers, and what is each group worth?
Current state, with segment migration tracked over quarters
Customer and transaction history across your sources, consolidated
Demand forecasting
What will demand be, and what's driving it?
Weeks to 18 months ahead, updating as new data lands
Sales history plus an event log: seasonality, holidays, weather
Inventory management
What stock do we need, where, and when?
Up to 18 months when fused with the demand forecast
SKU-level sales, supplier lead times, holding costs
Price elasticity
How does demand respond if we change price?
Scenario-based: models responses before you commit
Pricing and sales history, plus segmentation for per-segment answers
Media mix modeling
Which channels actually drive revenue, and how should budget split?
Quarterly and annual planning ranges
2+ years of spend history; meaningful media spend (roughly £750k+/yr)
Digital attribution
Which touchpoints influenced this purchase?
Near-term and tactical; days to weeks
Journey-level tracking data, fused with MMM to avoid contradictions
Creative diagnostics
Which creative attributes drive performance?
Campaign-cycle: informs the next flight of ads
Creative assets tagged and matched to performance data
The horizons in this table assume the data behind them is consolidated and trusted; every one of them shortens or collapses on an unreliable foundation. And the further out any model looks, the more it should be read as a planning range rather than a promise, an 18-month demand plan is for supplier negotiations, not a crystal ball.
The order matters because the models talk to each other
The ideal portfolio isn't seven separate purchases, but one group that all work together. Segments feed the elasticity model. The forecast feeds inventory. MMM and attribution check in on each other. The questions a business asks cut across all of them at once. Ian again: "What is actually driving sales? To what extent is price influencing demand, and for which segment? Those questions don't have clean answers when you're looking at each model independently."
That's the job of the orchestration layer, KAI Analytics monitors the interrelationships between models, with KAI Assistant on top so a non-technical user, from the C-suite for example, can ask what's driving the business, in plain English, and get one quick answer instead of six model outputs. For the CEO, the question was never "show me the forecast." It was always "is it price, or is it media?", and that question is only answerable when the models were built to be read together.
Should we hold back on starting?
Predictive analytics has a well-documented tendency to disappoint: a study of nearly 6,000 executives from the National Bureau of Economic Research found that while around 70% of firms now use AI, close to 90% report no measurable productivity impact. The gap is almost never the models. It's data underneath that the models run/are built on. If your teams don't agree on what revenue was last month, a demand forecasting model won't work properly, and our AI readiness assessment is a good first step, or if the foundation itself is the gap, start with the data stack decision rather than any models.
If you want a straight answer on which of the seven your business should build first, bring us your questions.


%201.svg)


%201.svg)
