How churn prediction works in 2026, and what customer segmentation adds
September 10, 2026
- min read
Henry Owen
Product Marketing Manager
TLDR:Churn prediction scores how likely each customer is to stop buying, by learning the patterns that preceded past departures. Churn analysis is the retrospective half: why customers left and which groups leave most. The catch is that outside subscriptions nobody cancels, so you define churn yourself, and by the time anyone meets that definition the money has gone.
Churn prediction estimates how likely each customer is to stop buying. A model is trained on customers who have already left, learns what their behavior looked like beforehand, and scores current customers against those patterns. The output is a probability per customer, usually grouped into risk tiers.
Churn analysis is the retrospective counterpart. It measures how much churn is happening, how it varies by cohort, channel or product, and what departing customers had in common. Most implementations need both: analysis establishes where churn concentrates, prediction identifies which individuals to contact.
Both depend on a definition of churn. In subscription businesses that definition is given, because cancellation is a recorded event. In retail and ecommerce it is not. Customers reduce their purchase frequency and eventually stop, with no action marking the point, so the definition has to be constructed.
For context on scale: the average ecommerce store loses 70 to 77% of its customers annually on Envive's benchmarking, and acquisition costs rose 222% over the eight years to 2025. The most cited retention figure, from Frederick Reichheld's Bain and Company research published in Harvard Business Review in the early 1990s, is that a 5% improvement in retention raises profits by 25 to 95%. That figure is three decades old and heavily recycled, so it is best treated as directional.
Defining the churn event
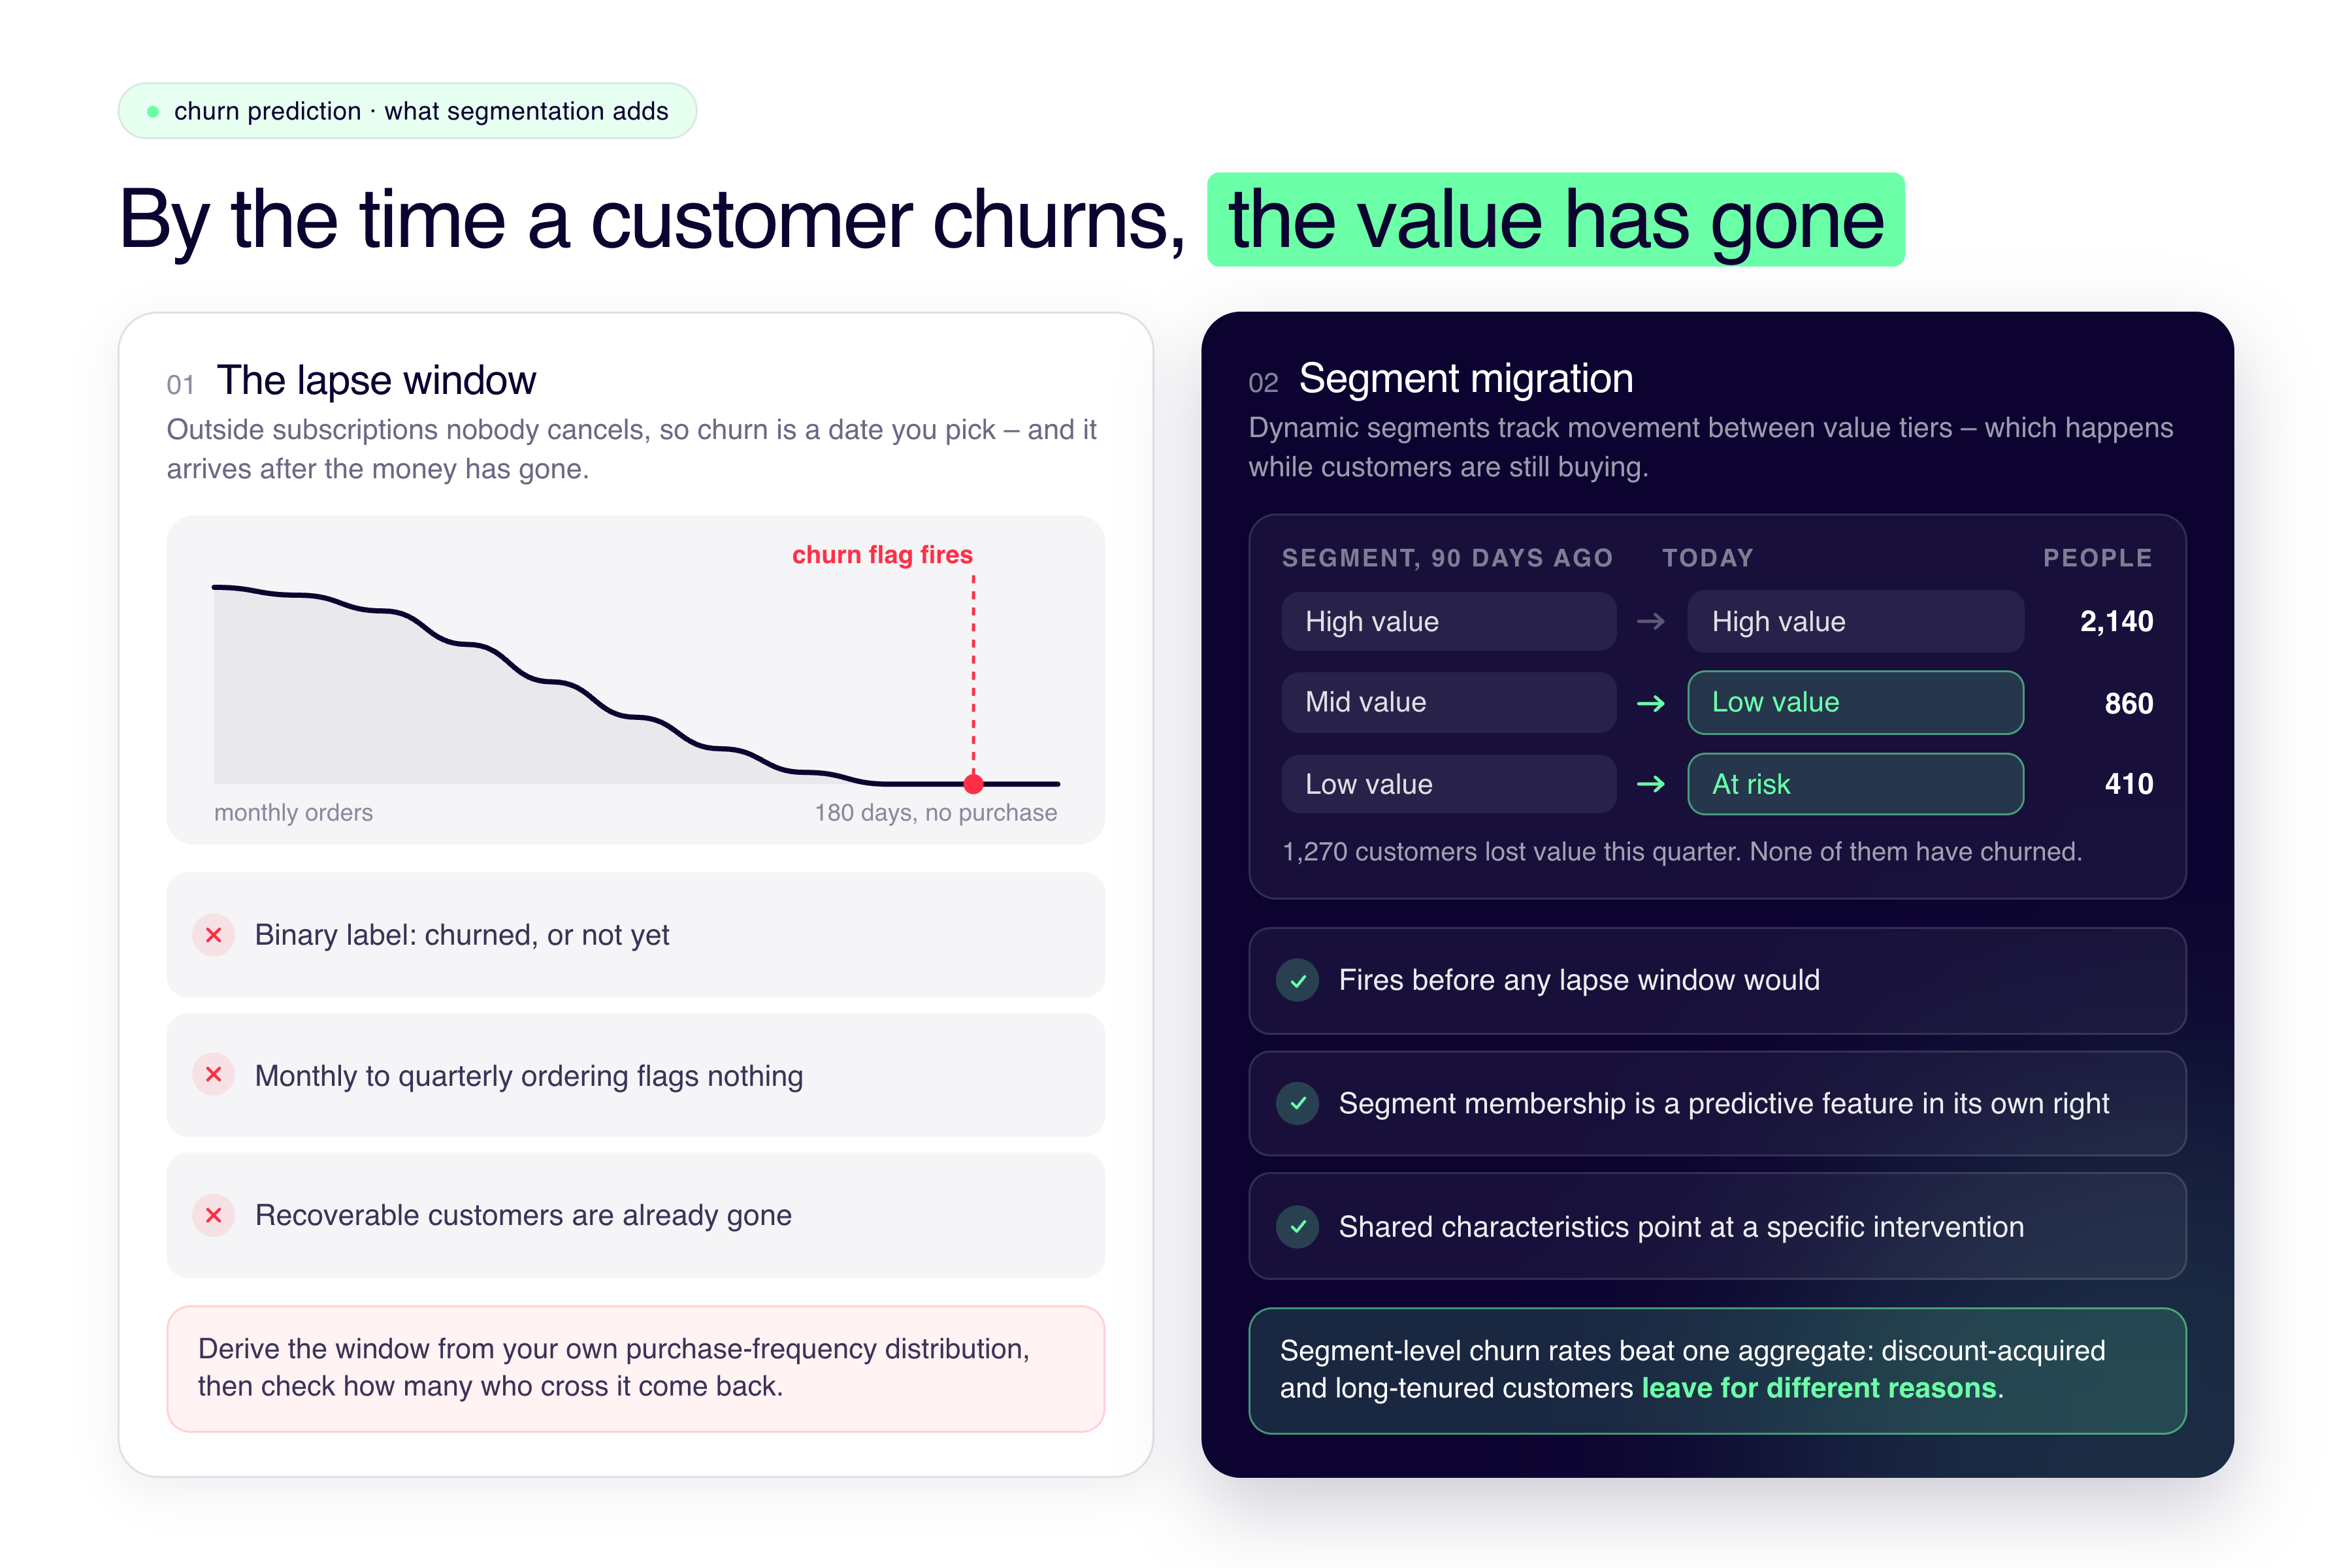
The standard method is a lapse window: a customer is classified as churned after a set number of days without a purchase.
The window length determines whether the model is useful. If customers typically order every three weeks and the window is set at twelve months, churn is only recognized long after the customer stopped buying, and the model will flag people who cannot be recovered.
A more reliable method is to derive the window from the purchase-frequency distribution. Measure the interval between orders across the customer base, set the window at a multiple of the median interval, then test what proportion of customers who cross that threshold subsequently return. A high return rate means the window is measuring a gap in purchasing rather than churn.
A binary churn label also describes customer behavior imprecisely. Customers commonly reduce spend gradually rather than stopping outright. A customer who moved from monthly to quarterly ordering has not met any reasonable churn definition and has already lost most of their annual value. This is the limitation segmentation addresses, covered below.
How customer segmentation adds to traditional churn prediction
Feature inputs
Model performance depends mainly on which behavioral signals are available. Recency, frequency and monetary value (RFM analysis) does most of the work, with engagement and friction signals adding the early warning.
Feature inputs for a churn model
Input
What it measures
Why it predicts churn
Recency, frequency, monetary (RFM)
Time since last order, purchase frequency, total spend
Carries most of the predictive weight on its own
Trend, not just level
Whether spend and frequency are rising or falling
Two customers at the same spend carry different risk depending on direction
Non-purchase engagement
Email opens and clicks, site sessions, app opens, wishlist activity
Declines before purchasing does, so acts as an early warning
Friction and service events
Support contacts, complaints, delivery failures, returns, failed payments
Payment failure is involuntary churn and separately fixable: recovery has been reported to return ~8.6% of revenue in year one
Category breadth
Number of product categories a customer buys across
Breadth correlates with retention, and narrowing often precedes churn
Segment membership and movement
Which value segment a customer sits in, and whether they are moving between segments
Migration happens while customers are still buying, so it is the earliest signal available
Model performance depends more on the quality and breadth of these inputs than on the choice of algorithm. All of them assume a single joined customer record; features derived from fragmented identity are inaccurate.
Model types
Three model families account for most production churn models. The choice matters less than the quality of the inputs above.
Churn model types compared
Model
What it outputs
Strength
Trade-off
Logistic regression
Churn probability, plus a coefficient per feature
Explainable, so the teams acting on it can see why a customer was flagged. The standard baseline
Misses interactions between features, so usually less accurate
Gradient-boosted trees XGBoost, LightGBM
Churn probability
Best performance on tabular customer data. Usually what ends up in production
Harder to explain, and easier to overfit
Survival analysis
Time to churn, not a yes or no
Treats customers who have not churned yet as information rather than negative cases. Answers when
Less familiar to most teams, and harder to communicate
Two issues affect all three. Class imbalance: if 4% of customers churn in the window, a model predicting no churn is 96% accurate, so judge on precision and recall for the churn class rather than accuracy. Leakage: a feature that only exists after churn, such as a cancellation-related support ticket, inflates test performance and fails in production.
How segmentation contributes
Segmentation groups customers into clusters that share behavior and value alongside their purchase patterns. Static segmentation assigns a fixed label, such as a spend tier or postcode band, and adds little to churn modeling.
Dynamic segmentation tracks customers moving between segments over time. That movement functions as an earlier churn signal than any lapse window, because value declines while customers are still purchasing.
A cluster of mid-value customers moving into a lower-value segment over three months will not be flagged by a churn model, since none of them have stopped buying. The revenue reduction has already occurred. Static segmentation surfaces this at the next review cycle; migration tracking surfaces it while it is happening, and allows the affected customers to be examined for shared characteristics. In one retail case the shared characteristic was lapsed engagement with a single product category, which identifies a specific intervention rather than a risk score.
Segmentation also improves the churn model directly. Segment membership and recent segment movement are predictive features in their own right. And segment-level churn rates are more actionable than a single aggregate rate, which averages together groups with different causes: discount-acquired customers and long-tenured customers churn for different reasons and respond to different interventions.
Churn modeling assumes customers can be identified consistently across systems.
Where one customer exists as separate records in an ecommerce platform, an email tool and an ERP, their purchase history is split across those records and every derived feature is inaccurate. Our Principal Analytics Consultant Tom Fordyce raises this when auditing a data stack. You need to know that customer A in one system is the same customer in another. Without proper mapping, in his words, "segmentation or revenue modeling just becomes a bit pointless."
The practical requirements are a joined customer record across source systems, transaction history covering enough time to establish patterns, and agreed definitions for the metrics involved. Our five-step data stack audit covers how to assess this.
Common failure modes
Churn projects usually fail for operational reasons rather than modeling ones.
A churn definition set too late produces flags for customers who cannot be recovered. A score with no intervention attached produces reporting rather than retention. An intervention run without a holdout group cannot be evaluated, because there is no way to distinguish customers who were retained from customers who were never going to leave. And a model built once and not retrained degrades as customer behavior changes.
A functioning implementation is continuous: a defensible churn definition, features that update as transactions arrive, scores delivered to the team that acts on them, a defined intervention, and measurement against a control group.
Related models
Churn prediction is more accurate and more useful when it shares inputs with other models. Segment codes feed it. Its output improves customer value forecasting, and marketing attribution becomes more informative when channels can be assessed on the retention of the customers they acquire rather than on first purchases alone.
This is how the KAI Analytics models are structured, with segmentation as a shared layer that other models draw on, so churn scores, forecasts and attribution results describe the same customer definitions. Kleene includes an analyst and data engineering team who build and maintain these, which addresses the operational failure modes above.
FAQ
What is churn prediction? Churn prediction uses historical customer data to estimate how likely each current customer is to stop buying. A model learns the behavioral patterns that preceded past departures, then scores active customers against those patterns, usually producing a probability and a risk tier per customer.
What is the difference between churn prediction and churn analysis? Churn analysis is retrospective and looks at groups: what the churn rate is, how it varies by cohort or channel, and what customers who left had in common. Churn prediction is forward-looking and scores individuals on their likelihood of leaving. Analysis identifies where the problem is, prediction identifies who to contact.
How do you predict churn when customers never cancel? You define a churn event, usually as a lapse window, meaning no purchase within a set number of days. Derive that window from your own purchase-frequency distribution rather than choosing a round number, and confirm that customers who cross it rarely return. Otherwise the model is trained on a gap in purchasing rather than on churn.
Which model is best for churn prediction? Gradient-boosted trees such as XGBoost or LightGBM generally perform best on tabular customer data. Logistic regression is the explainable baseline and is worth building first. Survival analysis is appropriate when you need to estimate when a customer is likely to leave rather than only whether.
How does customer segmentation help with churn? Dynamic segmentation tracks customers moving between value segments over time, and that movement occurs before churn does. A customer moving from a mid-value to a lower-value segment has not churned, so a churn model will not flag them, but the revenue reduction has already happened. Segment membership also works as a predictive feature, and segment-level churn rates are more actionable than a single aggregate rate.
What data do you need for churn prediction? A joined customer record across source systems, transaction history covering enough time to show patterns, and behavioral signals beyond purchases such as email engagement and support contacts. Fragmented customer identity is the most common blocker, since features derived from partial histories are inaccurate.
Summary
Churn prediction scores individual customers on their likelihood of leaving. Churn analysis measures where and why churn occurs. Both depend on a constructed churn definition, and both share the limitation that by the time a customer meets that definition, most of their value has already been lost.
Tracking movement between value segments addresses that limitation, since migration occurs while customers are still purchasing.
To assess whether your data supports this, tell us which systems your customer data sits in and we will confirm whether churn modeling is viable or whether the data joining work needs to happen first.


%201.svg)


%201.svg)
