ROAS marketing in 2026: what a good return on ad spend looks like
August 19, 2024
- min read
Henry Owen
Product Marketing Manger
Updated June 2026
What counts as a good ROAS in 2026
It realy depends on your margins, your channel, and your goal. But the benchmarks give you a starting line, and they moved this year.
Average ROAS landed around 2.9x in 2026, down roughly 10% year on year as costs per click rose and conversion rates fell (WebFX). Google paid search tends to run higher, near 3.5x median, while Meta sits in the 2.8x to 3.6x range depending on industry (Landingi). Category matters more than any global figure: beauty and personal care can clear 6x on search, while healthcare and some regulated sectors sit closer to 2x.
A 4:1 ROAS is the rule of thumb people quote, but it is a rule of thumb, not a target.
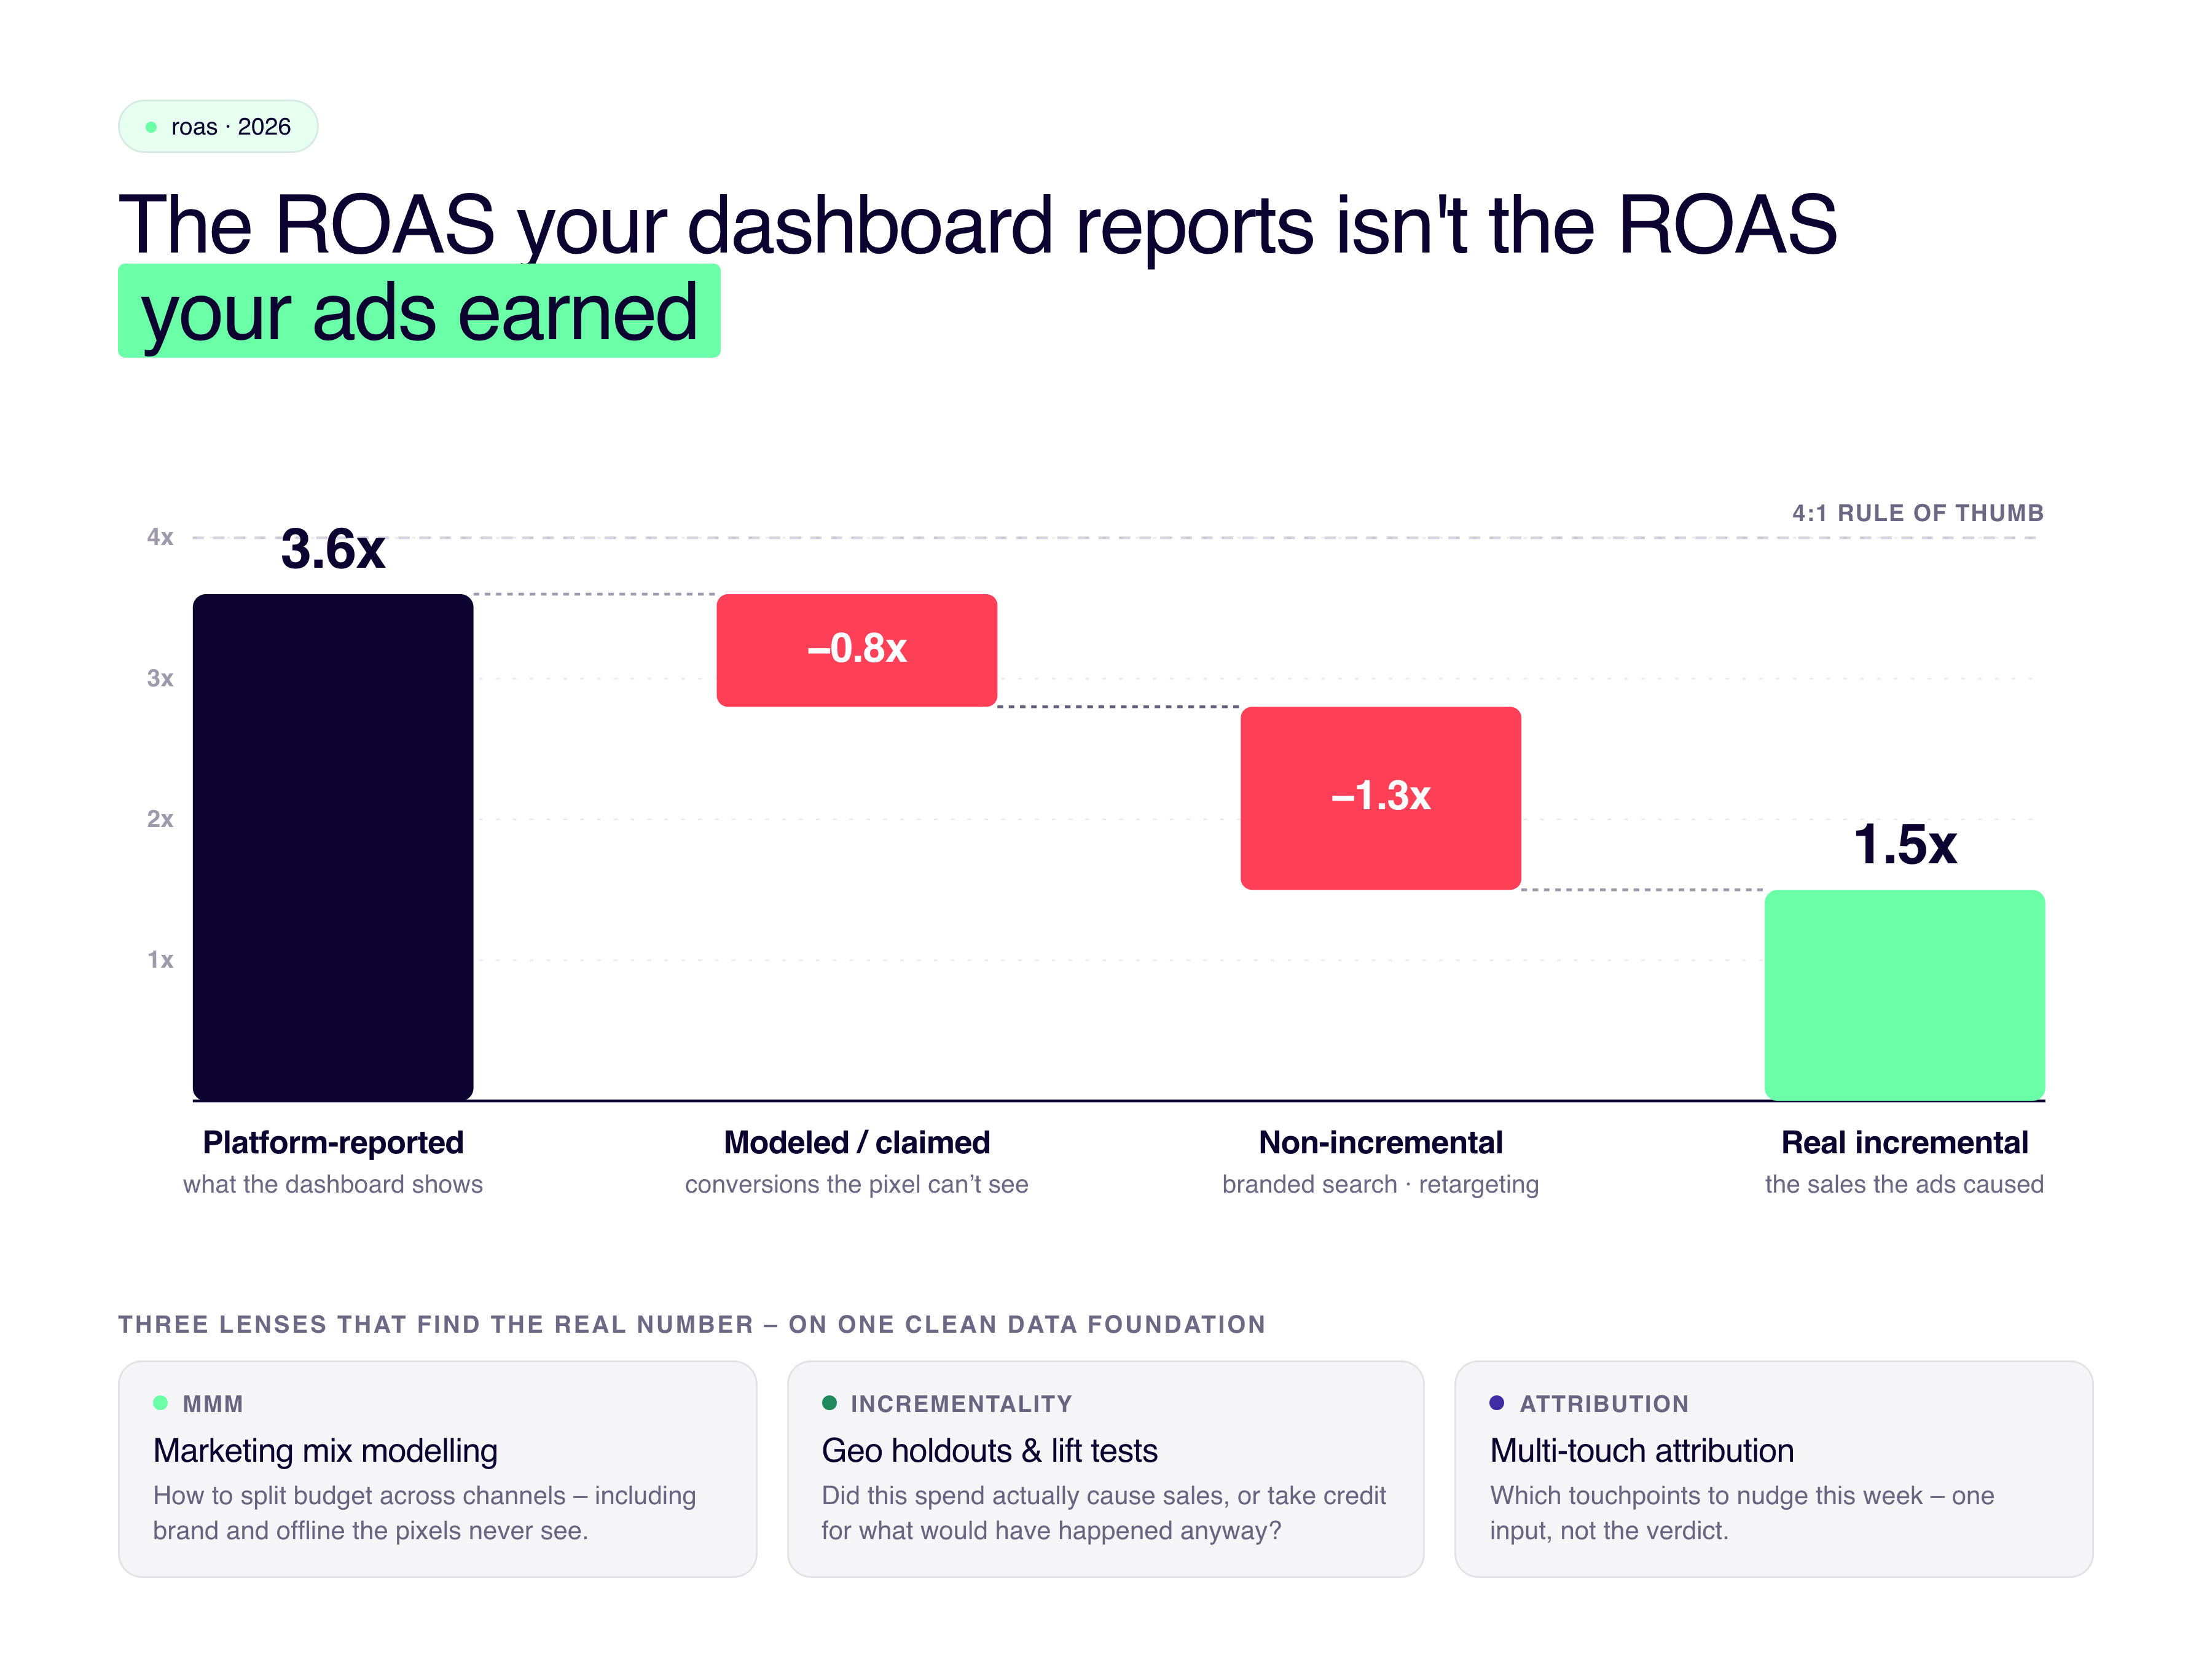
The difference between reported ROAS, which typically ignores profit, and incremental ROAS which shows the real figure
Why the reported number lies
Two things have happened to ROAS, and most dashboards hide both.
First, ROAS ignores profit. Revenue is not margin. A campaign can post a beautiful return and still drain cash if it is selling your thinnest-margin lines or leaning on discounts to do it. This is why more teams now track POAS, profit on ad spend, alongside ROAS: same idea, but measured on contribution rather than top-line revenue.
Second, and more serious, the platforms grade their own homework. Since the iOS privacy changes, a large share of users opt out of tracking, and the ad networks can no longer tie many conversions back to a specific ad. To fill the gap they model and claim conversions, and the numbers do not reconcile: analyses in 2026 put the gap between platform-reported and actual performance at roughly 15 to 30% (Adligator). Worse, the campaigns that report the highest ROAS are often the ones taking credit for sales that would have happened anyway, branded search and retargeting being the usual suspects (SegmentStream). Optimise hard to platform-reported ROAS and you can pour budget into ads that change nothing while starving the ones driving new demand.
The number you actually want: incremental ROAS
The question worth answering is "what would have happened if we had not run this campaign." That gap, the extra sales the ad caused, is incrementality, and it is the figure that protects both growth and margin.
In practice, three lenses answer three different questions, and the strong teams run all three on one clean data foundation (Measured):
Marketing mix modelling (MMM) for the quarterly and annual question: how should we split the budget across channels, including the offline and brand spend the pixels never see. We go deeper on this in our MMM with AI playbook and on why platform reporting misses the full picture.
Incrementality testing for the causal question: did this spend cause sales, proven with geo holdouts and lift tests rather than self-reported attribution.
Multi-touch attribution for the daily question: which touchpoints to nudge this week. Useful, but the weakest of the three on its own, which is why our guide to marketing attribution after cookies treats it as one input, not the verdict.
Run together, they turn ROAS from a vanity read into a budget you can defend: spend that improves both ROAS and incremental revenue, not just the dashboard.
The bit nobody tells you: it is a data problem first
To measure incremental, profitable ROAS you need ad spend from every channel, order and margin data from your commerce and finance systems, and customer data, all in one place and agreeing with each other. For most teams that data is scattered: Google Ads in one tab, Meta in another, TikTok in a third, Klaviyo somewhere else, and the real revenue sitting in Shopify and the finance system that none of the ad tools can see.
Until that is consolidated, every ROAS number is built on a different definition of revenue, and the models have nothing trustworthy to run on. Pulling marketing spend together into one source of truth is the job people often go looking for a Funnel.io alternative to do. Tie it back to customer lifetime value and customer acquisition cost and the picture finally holds together.
Where Kleene fits
Kleene consolidates marketing, sales, and finance data into one source of truth, so ecommerce, finance, and marketing teams report from the same trusted numbers instead of three arguing dashboards. On top of that foundation sit our proprietary models, including media mix modelling, attribution, and price elasticity, so you can see which spend is incremental and which is just taking credit.
KAI, our plain-English assistant, lets a marketing or finance lead ask "which channels drove incremental revenue last month, and where should the next £50k go" and get an answer drawn from your own data. If you are weighing an AI platform to improve ROAS and incremental revenue, that combination, consolidated data plus the models plus plain-English access, is the thing to look for.
Frequently asked questions (FAQs) about ROAS marketing
1. What is ROAS in marketing?
ROAS stands for return on advertising spend. It measures the revenue generated for every pound spent on advertising. Spend £1,000 and generate £5,000, and your ROAS is 5:1. It is the quickest read on whether your advertising is paying its way.
2. What is a good ROAS in 2026?
It depends on your margins and channel, but for context the average sat around 2.9x in 2026, with Google paid search nearer 3.5x and Meta in the 2.8x to 3.6x range (WebFX, Landingi). A 4:1 ratio is the common rule of thumb, but a high-margin product can be profitable far below it and a low-margin one can lose money above it.
3. How do I calculate ROAS?
Divide the revenue generated by your ads by the cost of those ads. £5,000 revenue from £1,000 of spend is a ROAS of 5. For worked examples, see our ROAS formula guide.
4. What is the difference between ROAS and POAS?
ROAS measures revenue per pound of spend; POAS (profit on ad spend) measures profit per pound of spend. POAS accounts for margin, so it catches the campaigns that look great on revenue but quietly lose money once cost of goods and discounts are included.
5. Why is my platform-reported ROAS higher than my real ROAS?
Since the iOS privacy changes, ad platforms cannot attribute many conversions directly, so they model and claim them, and they tend to take credit for sales that would have happened anyway. Reported figures can diverge from actual performance by roughly 15 to 30% (Adligator).
6. What is the difference between ROAS and incrementality?
ROAS tells you the revenue attributed to a campaign. Incrementality tells you the revenue the campaign actually caused, the sales that would not have happened otherwise. High-ROAS campaigns frequently have low incrementality, which is why incrementality testing and marketing mix modelling matter for budget decisions (SegmentStream).
7. What is the best way to improve ROAS and incremental revenue?
Start with clean, consolidated data across all ad channels and your real revenue, then use marketing mix modelling and incrementality testing to move budget toward the spend that genuinely drives new sales. The gains usually come from cutting non-incremental spend, not from squeezing the platforms harder.
8. How do I consolidate marketing spend data across channels?
Bring every ad platform, plus your commerce and finance data, into one source of truth so every channel is measured against the same definition of revenue. A managed data platform like Kleene does this without a large data team, which is why teams often choose it over assembling a Funnel.io-style marketing-data stack themselves.
When evaluating your marketing results, make sure your findings are statistically significant before you reallocate budget. Use our free statistical significance calculator to validate the read first.

%201.svg)


%201.svg)
