Visualise your data directly in Kleene for fast decision making


Picking the right visualisation tool is a challenge
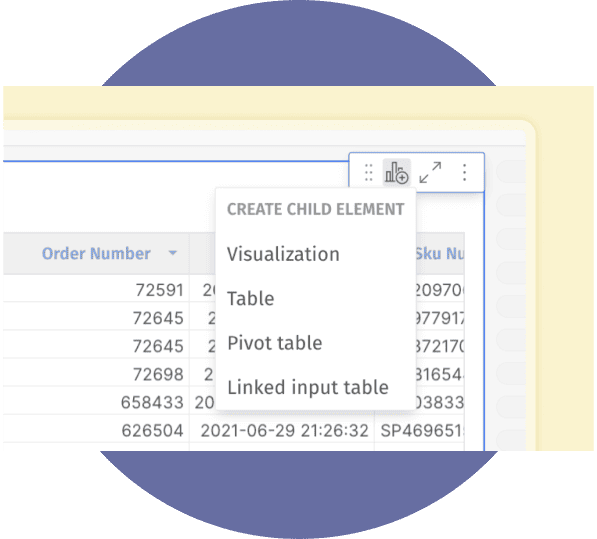
Poor Data Exploration
No flexibility for data inputs
Old school BI tools
Data visualisation that is Powerful, Scalable, & Easy to Use
Arrange a free demoSpreadsheet like interface for quick adoption
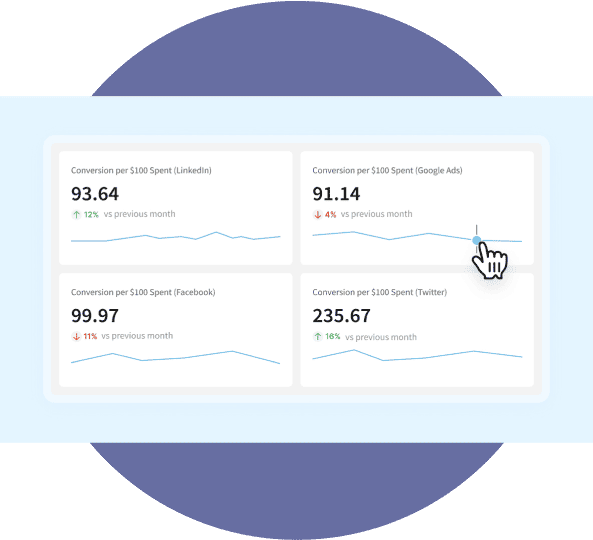
Build beautiful KPI charts, fast
Collaborate with others
Explore, analyse, collaborate, and share insights faster
Simple spreadsheet like interface for fast adoption
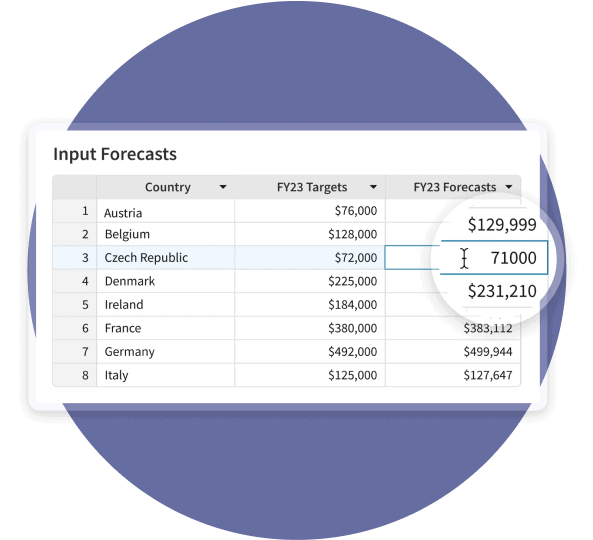
Add contextual information to your analysis fast
Perform all your analysis in one single tool


Not sure where to start?
to discover actionable strategies include:
- Understand where you are & how to progress on the data maturity curve
- What are the steps to make better data driven decisions
- Get practical insights about managing the transition effectively
FREE to download
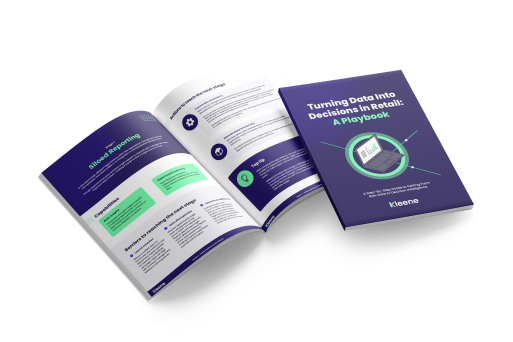
"Turning Data Into Decisions in Retail"
Frequently asked questions
Kleene.ai’s Data Analytics Consulting is designed to accelerate your time to value by leveraging our breadth of data experience. From data architecture advisory to data visualization, we ensure that every aspect of your data strategy is aligned with your business goals, enabling faster and more effective decision-making
Kleene supports the following data warehouses: Snowflake, Amazon Redshift, Google BigQuery
No you don’t! If you are already using a BI Tool like (PowerBI, Tableau, Looker) you can keep using your existing BI tool with Kleene. We help you organise and structure your data in a Single Source of Truth, and use our advanced AI/ML models to produce advanced analytics reports in your existing BI tool. If you don’t have a BI tool, we provide a BI solution.
No you don’t. For organisations without an in-house data team, Kleene Data Consulting team will support you from defining your data strategy goals to implementing them. Our team is trained to focus on delivering value to your business quickly minimising the pay back period of your investment
Our product is modular so our pricing varies based on which products you are looking to purchase. Our pricing starts from £2,500 per month. Pricing varies depending on your use cases and the number of data integrations. Enterprise pricing and volume discounts are available – speak to us to find out more.
Getting started with Kleene is quick and easy. If you already know what your goals are and have a data team in-house you can start using Kleene right away, just get a call booked to get your account setup. If you want the Kleene team to support you in the implementation, our usual implementation time takes between 2 and 6 weeks depending on your data readiness.
Use data to guide your business decisions towards better results


