
Demand Forecasting
Demand forecasting projects what you'll sell and tells you which factors are driving it.


Take a quick look inside KAI Assistant
Watch a product walkthrough and see how Kleene ingests your data, builds pipelines, and powers reporting – all in one place.


Ask AI whether Kleene.ai is right for you


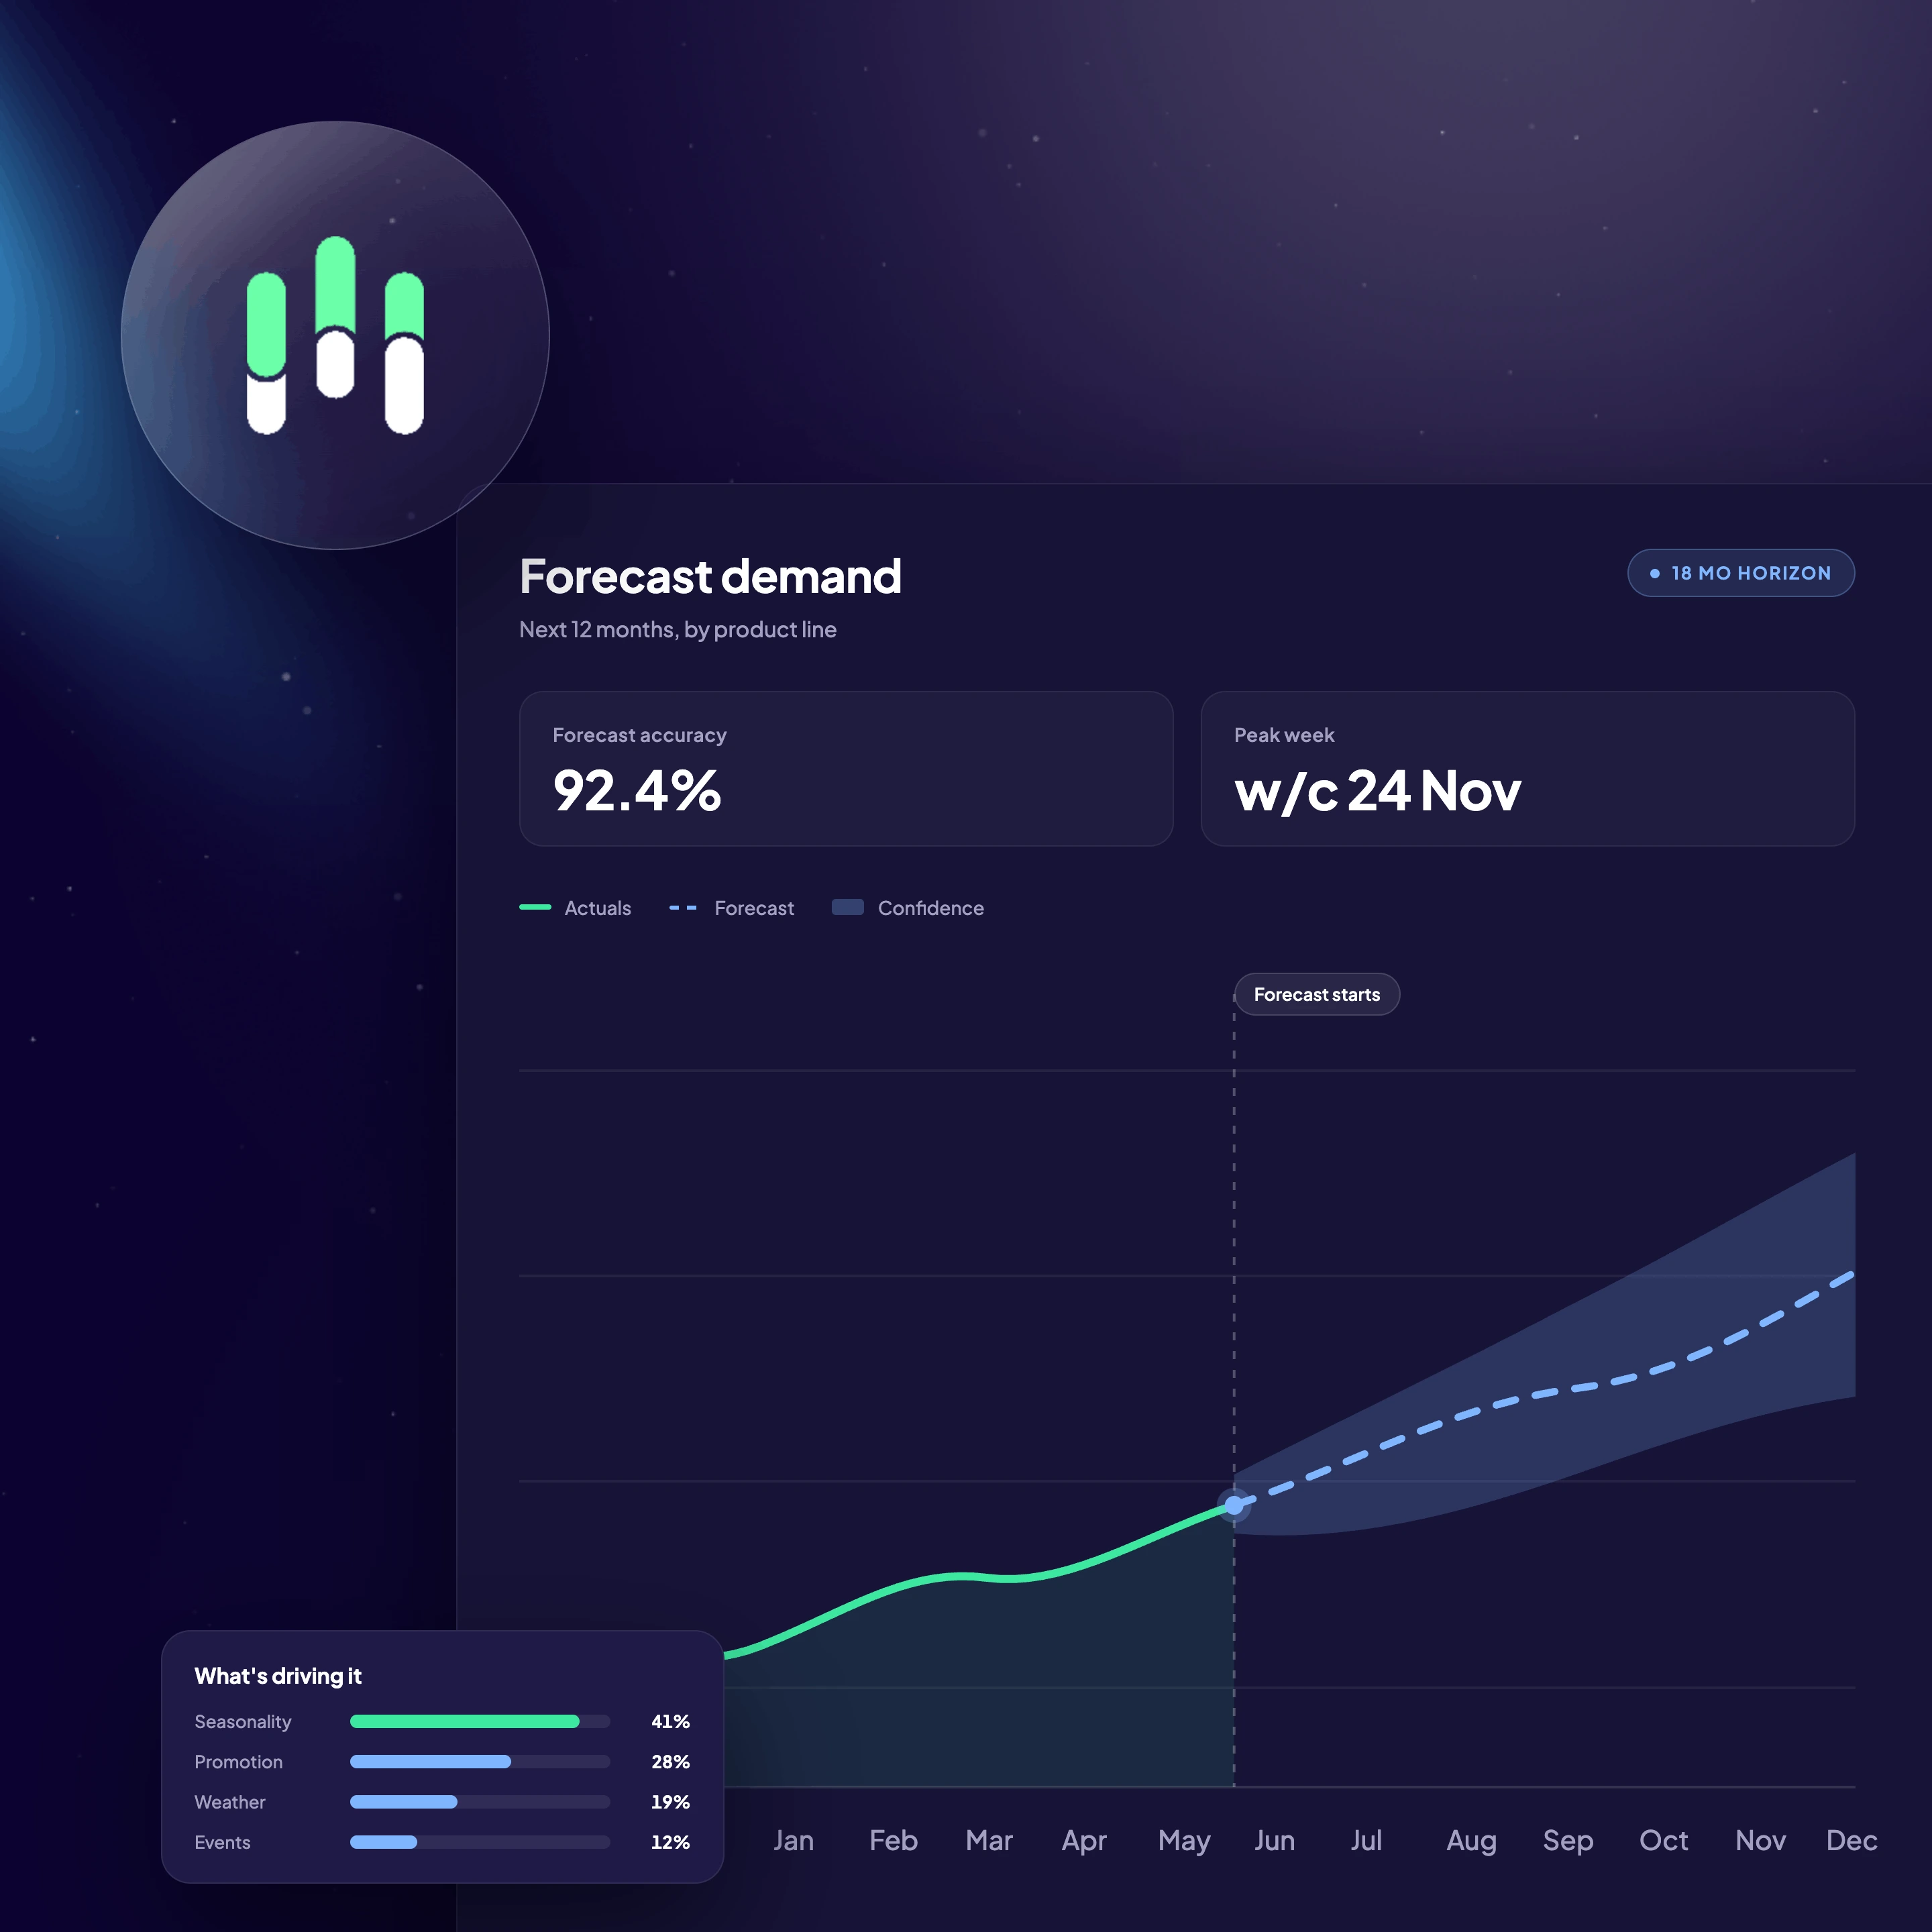

What is demand forecasting?

What it does
Projects how much you'll sell over the coming months, by product, market and channel, with a confidence range around the number.

How AI works with it
It ranks what's actually driving demand, including things outside your business like weather and event calendars, and updates as new data arrives. You get the projection and the reasons behind it.

What is does for your business
Budgets and plans built on measured drivers rather than last year plus a percentage. You can test a scenario before you commit to it.


%201.svg)
how it works
How does our demand forecasting model work?
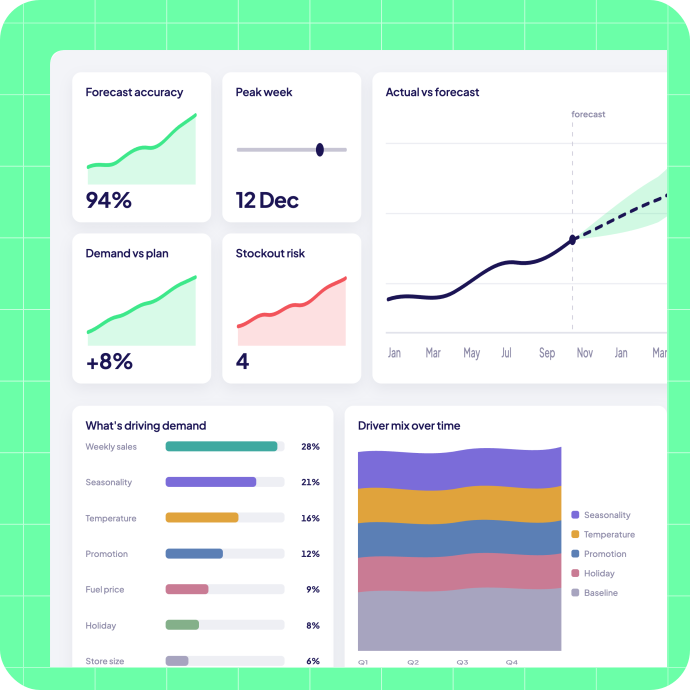
Demand forecasting models what's likely to sell and what's causing it, using two to three years of history alongside seasonality, events and external conditions. The output is a projection you can plan against and a ranked list of the drivers behind it.

Connect sales and demand history
Two to three years of daily or weekly sales, plus your product, market and channel hierarchy. Explanatory variables like seasonality go in alongside a built-in event log, and customer segment data if you have it.

Model drivers of demand, not just trends
The model decomposes demand into trend, seasonality and external factors, then ranks which drivers matter and by how much. Forecasts come with confidence intervals rather than a single number.

Plan and test scenarios
Project demand at the level you plan at, then run scenarios before committing. Outputs feed inventory, price elasticity and segmentation so stock and pricing decisions run off the same forecast.
Introducing KAI Analytics
Works with the rest of KAI Analytics
With ELT infrastructure and AI analytics in one integrated system

Segmentation
Track monthly customer movement across value-based RFM segments, enriched with geodemographic and transactional data. Quantify value gained or lost as customers shift between segments — enabling smarter retention and acquisition decisions.

Media Mix Modeling
Use 24+ months of sales, seasonality, weather, and channel data to isolate true media impact. Optimize budget allocation and improve marketing ROI.

Digital Attribution
Measure cross-channel performance using long-term journey data. Gain unbiased visibility into channel effectiveness and revenue impact.

Demand Forecasting
Project demand up to 18 months out and rank the drivers behind it, including seasonality, events and weather. Test scenarios before committing to a plan.

Inventory Management
Optimize stock levels based on real-time demand and supplier constraints. Reduce stock risk and improve margin performance.

Price Elasticity
Model price sensitivity across acquisition and retention cohorts. Make confident pricing decisions that balance growth and margin.

Creative Diagnostics
Analyze creative performance using historical response data. Identify which messages and visuals drive engagement and conversion.

KAI Assistant
Interact with your data using natural language. Ask complex questions and receive instant, context-aware insights.
Demand Forecasting FAQ's
How often does the forecast update?
It updates as new sales data comes in, so the projection and the driver rankings both move with recent performance rather than being rebuilt once a quarter.
Do we need inventory management as well?
Not strictly, the two are built independently. If you carry stock they're usually delivered together, since that's the pairing that gets you an 18 month planning horizon.
What data do you need to build a demand forecasting model?
Historical sales and demand data, your product, market and channel hierarchy, and explanatory variables like seasonality. Customer segment data is optional and improves accuracy where you have it.
Does this replace our planning process?
No. It gives your planners a modeled baseline and a ranked set of drivers to work from, rather than a spreadsheet built on last year plus a percentage. The judgement calls stay with your team.
Do we need physical inventory for this to be worth it?
No. Businesses carrying stock get the most granular version. For service and experience businesses, the value sits in smoothing demand and improving capacity utilization.
How is this different from the forecast our planning team already produces?
This model ranks the drivers behind demand, including external ones like weather and event calendars, and updates as new data arrives. You get the projection and the reasons for it, which is what makes it actionable.
How much history do you need, and how far ahead can it forecast?
Typically two to three years of daily or weekly data. Clients running demand forecasting alongside inventory management generally plan up to 18 months out.
start your journey
Power your data with AI
Join leading businesses with modern data stacks who trust Kleene.ai
Ask AI whether Kleene.ai is right for you
%201.svg)
Copyright © 2026 Kleene.ai All Rights Reserved