What is predictive analytics and why it matters in 2026
April 22, 2025
- min read
Henry Owen
Product Marketing Manger
Updated May 2026
Predictive analytics used to mean hiring a specialist firm, waiting months for a model, and getting a report back when the moment to act on it had already passed. That description is mostly out of date now, but a lot of businesses are still operating as if it isn't.
The methodology hasn't changed. The statistics behind demand forecasting or churn prediction are the same as they've always been. What changed is the cost to run it, how long it takes to see something useful, and whether the people who need the outputs can actually get to them. Those three things shifted significantly in the last couple of years, and for mid-market businesses especially, the implications are pretty substantial.
What it actually is
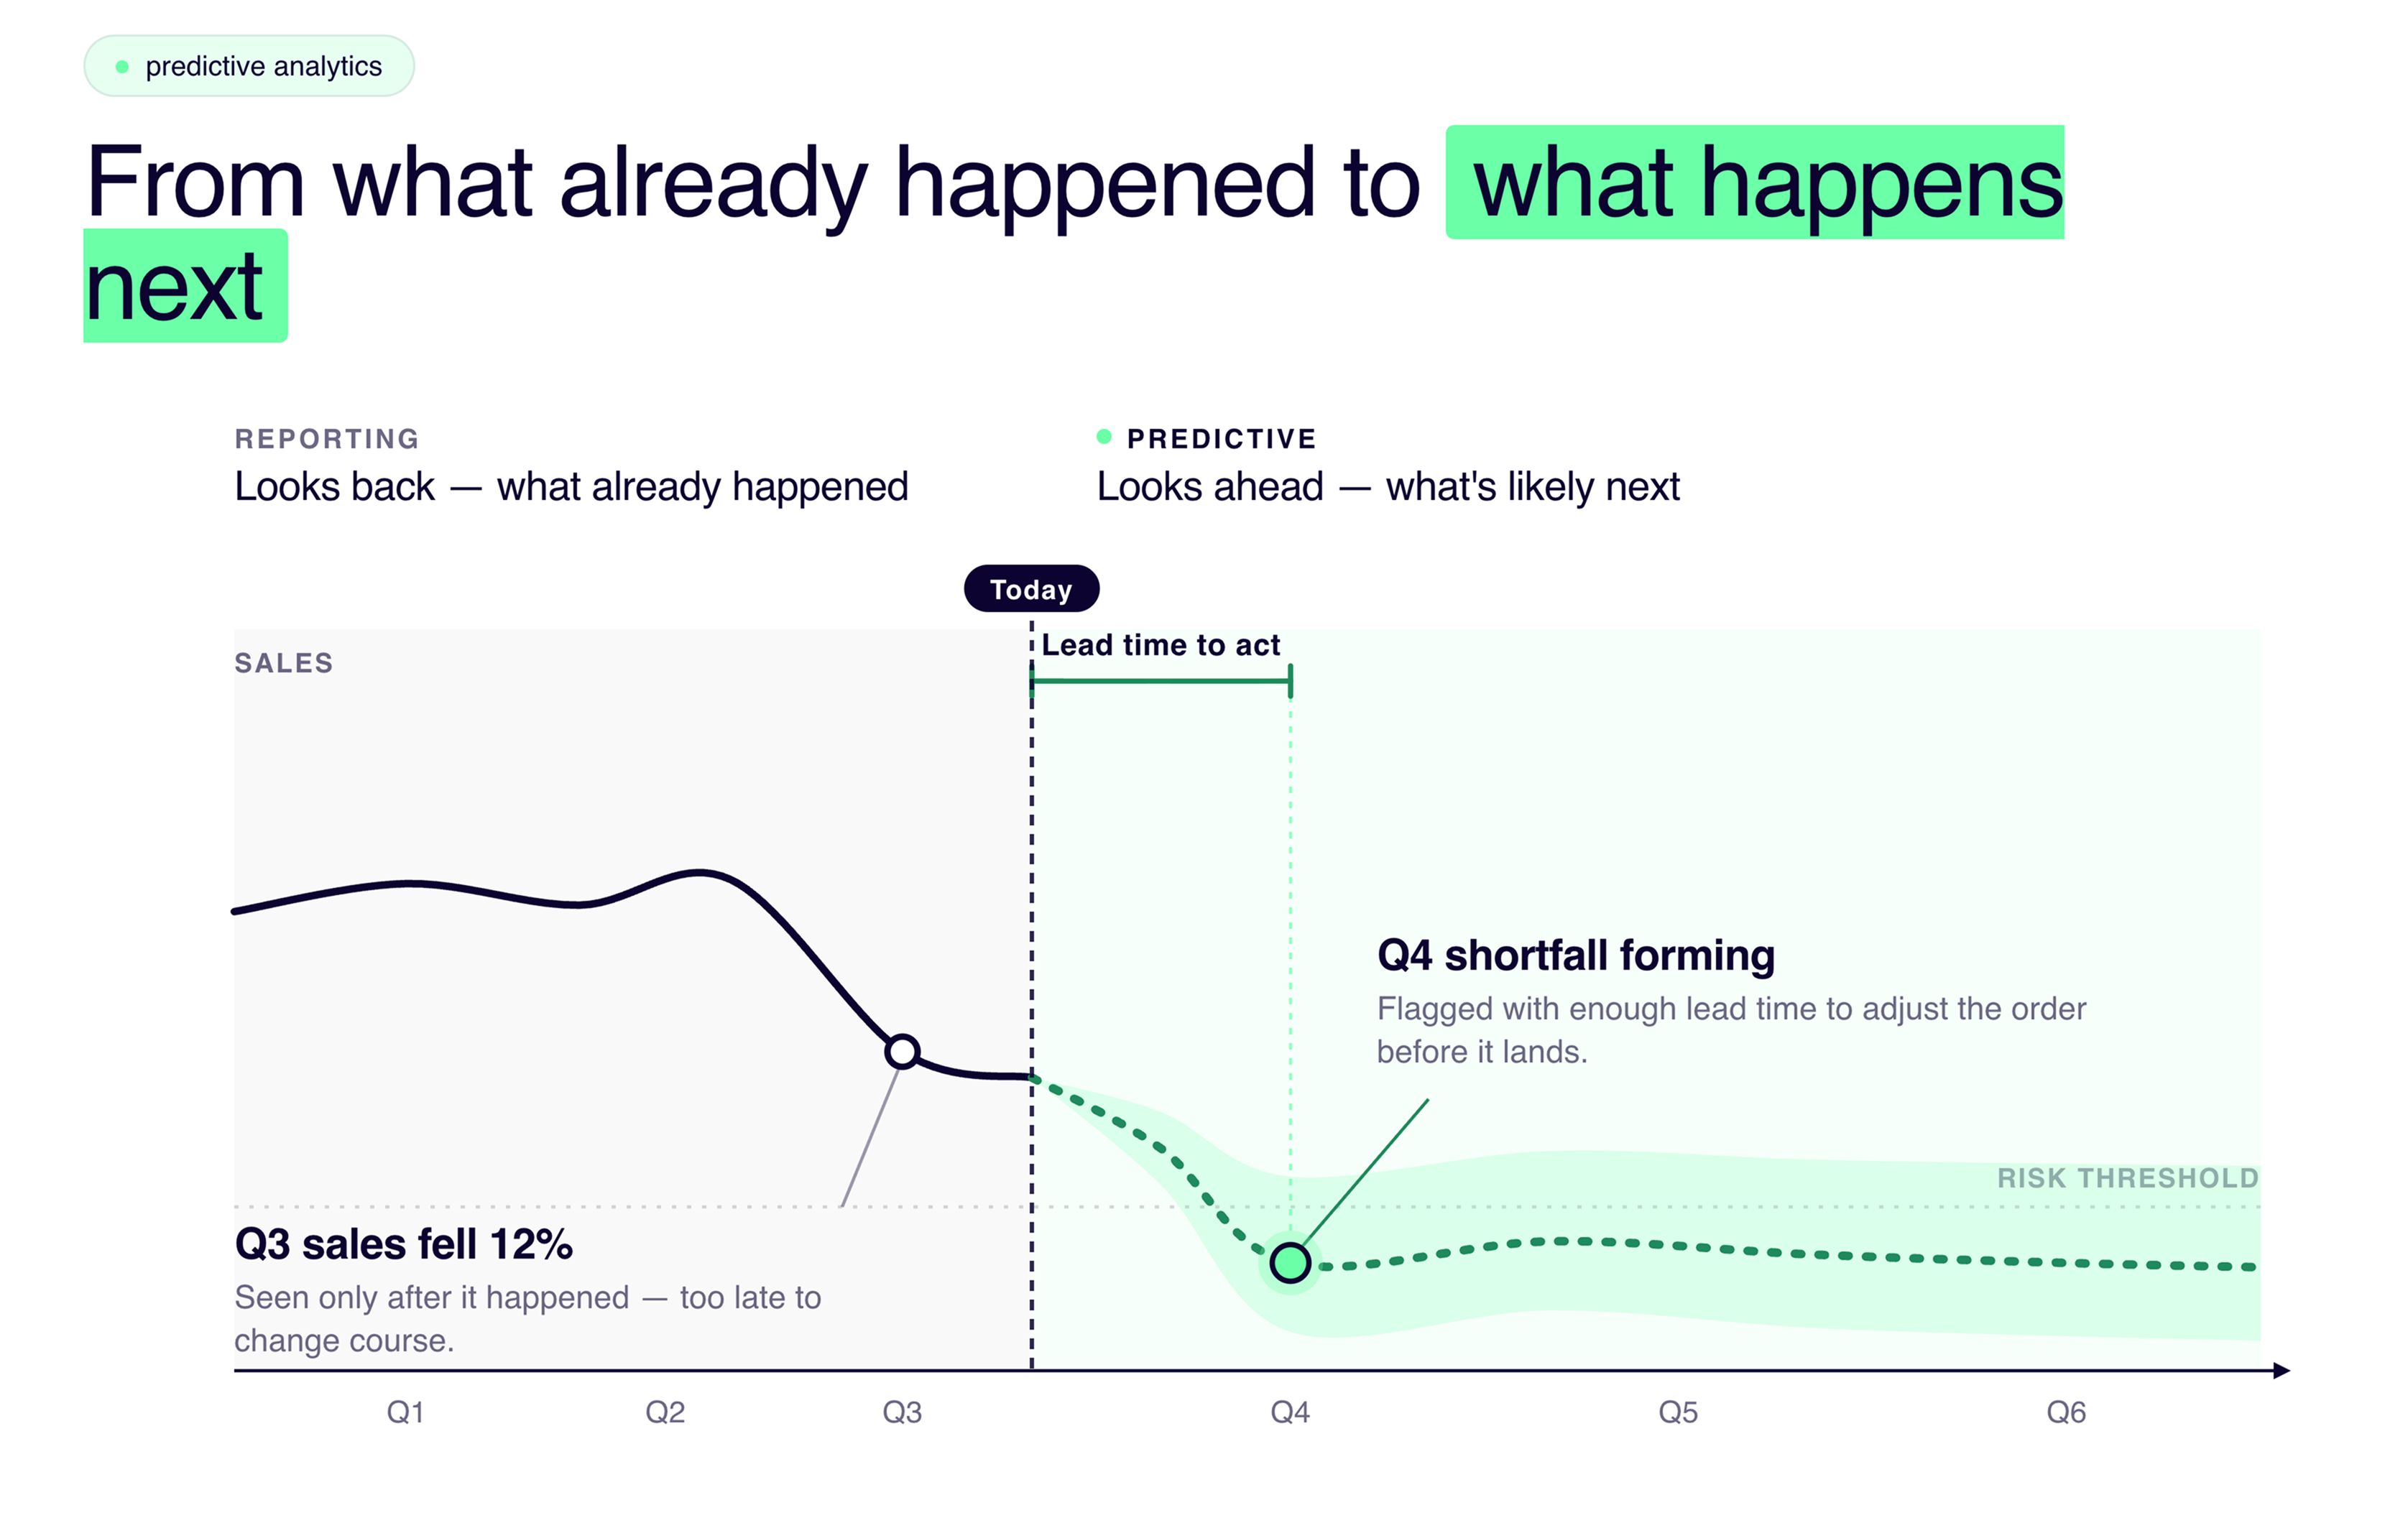
Predictive analytics uses historical data and statistical models to generate views of what's likely to happen next. Not what happened last month. That's reporting. Predictive analytics is the difference between a dashboard that tells you sales dropped 12% in Q3 and a model that tells you which product lines are heading toward a problem in Q4, with enough lead time to do something about it.
See a Q4 shortfall forming before it lands, with enough lead time to actually do something about it
The questions it answers tend to be things like: which customers are most likely to stop buying in the next 60 days? What's demand going to look like across your SKUs before the inventory order goes in? Which marketing channels are actually driving incremental revenue versus taking credit for conversions that would have happened regardless?
Most businesses have plenty of data that could answer those questions. The issue is usually that it's sitting in three different systems, nobody's connected it up properly, and the analyst who could build something useful from it is already backlogged with other requests.
How it works without a data science team
At a basic level, a predictive model gets trained on historical data, learns which patterns hold over time, and applies those patterns to current data to produce forward-looking outputs. Demand forecasting uses past sales alongside seasonality, promotions, and lead time data. Churn prediction uses transaction history and behavioral signals. Media mix modeling uses historical spend and sales data to separate what marketing actually drove from what would have happened anyway.
You don't need to understand the statistics to use the outputs. What you do need is data that's clean and structured consistently enough that the model is learning from something real rather than noise.
That's still where most implementations fall over, by the way. Not the modeling. The data underneath it.
What's actually different in 2026
Three things have changed enough to matter.
The cost to get started has come down a lot. Building a custom forecasting model used to mean a specialist engagement or a data scientist hire. Pre-built models that run on your existing warehouse data have made that unnecessary for most standard use cases. It's not free, but it's no longer out of reach for businesses that aren't running large data teams.
Models now update continuously rather than sitting static between engagements. The older approach produced a snapshot — here's what your data says as of this project. The problem is that data doesn't stay still. Demand patterns shift, customer behavior changes, new channels come online. A model that was built six months ago and hasn't been touched since is working off a picture of the business that may not look much like the current one. AI-native platforms keep models live, which matters a lot if your business has any meaningful seasonality or frequent promotions.
Non-technical users can now actually get to the outputs without going through an analyst. KAI Assistant in Kleene.ai lets finance leads, operations managers, and marketing directors ask questions about forecast outputs and customer segments in plain English, without submitting a request to the data team and waiting. The insight exists in the platform. The question is just whether the right person can reach it before the window closes.
Where it actually makes a difference
The use cases that tend to deliver the clearest return are the ones where a wrong decision has a material cost and where current information arrives too late to change course.
Inventory is the obvious one. An order placed on last quarter's numbers is going to be wrong in ways that cost money: overstock in categories that slowed down, stockouts in the ones that accelerated. A demand forecasting model that accounts for seasonality and current sell-through rates changes what that order looks like before it goes in.
Customer retention is another. By the time someone churns, it's usually too late. A churn model that flags accounts with declining engagement 60 days out gives the team enough time to do something. Not guaranteed to work, but considerably better than finding out on the cancellation report.
Marketing attribution is where most businesses are most wrong without knowing it. Platform-reported ROAS is self-reported by the ad platforms and tends to be optimistic. A media mix model that measures what channels actually drove incremental sales, independent of what those channels claim, usually produces a different picture of where budget should go.
How this works in Kleene.ai
Kleene.ai's KAI Analytics Suite includes pre-built predictive models running directly on warehouse data: demand forecasting, customer segmentation, churn prediction, media mix modeling, digital attribution, price elasticity, and inventory management. Kleene's team maintains and updates the models, so businesses aren't carrying the engineering overhead of keeping them running.
KAI Assistant sits across all of it. Anyone in the business can ask questions about what the models are showing without needing to write SQL or wait for a report to be prepared.
For businesses that already have data flowing through a warehouse, the path to live predictive outputs is typically weeks rather than months. For businesses that don't, the data foundation work comes first, and that's where most of the value actually gets built, because the model is only ever as good as what's underneath it.

%201.svg)


%201.svg)
