Best TikTok analytics tools: a complete guide for data-driven content creators
December 11, 2024
- min read
Henry Owen
Product Marketing Manager
Most guides to TikTok analytics are written for solo creators trying to grow a following, which is fine if you're a solo creator. If you're a brand running TikTok as one channel among many, the advice mostly doesn't apply, because your problem isn't "why did this video underperform." It's "what is TikTok actually contributing to the business, and how do I see that next to everything else we spend money on." Those are different questions, and the tools that answer the first are not the tools that answer the second.
This guide is for the brand side of that line. It covers what TikTok's own analytics now track after the 2026 overhaul, the third-party tools worth knowing, and the point most marketing teams reach where single-platform analytics stop being enough.
What data driven content creators need to know about TikTok analytics tools in 2026
What changed in TikTok's own analytics this year
If your last mental model of TikTok analytics is a couple of years old, update it, because TikTok rebuilt the dashboard in 2026 and moved the goalposts on what counts as performance.
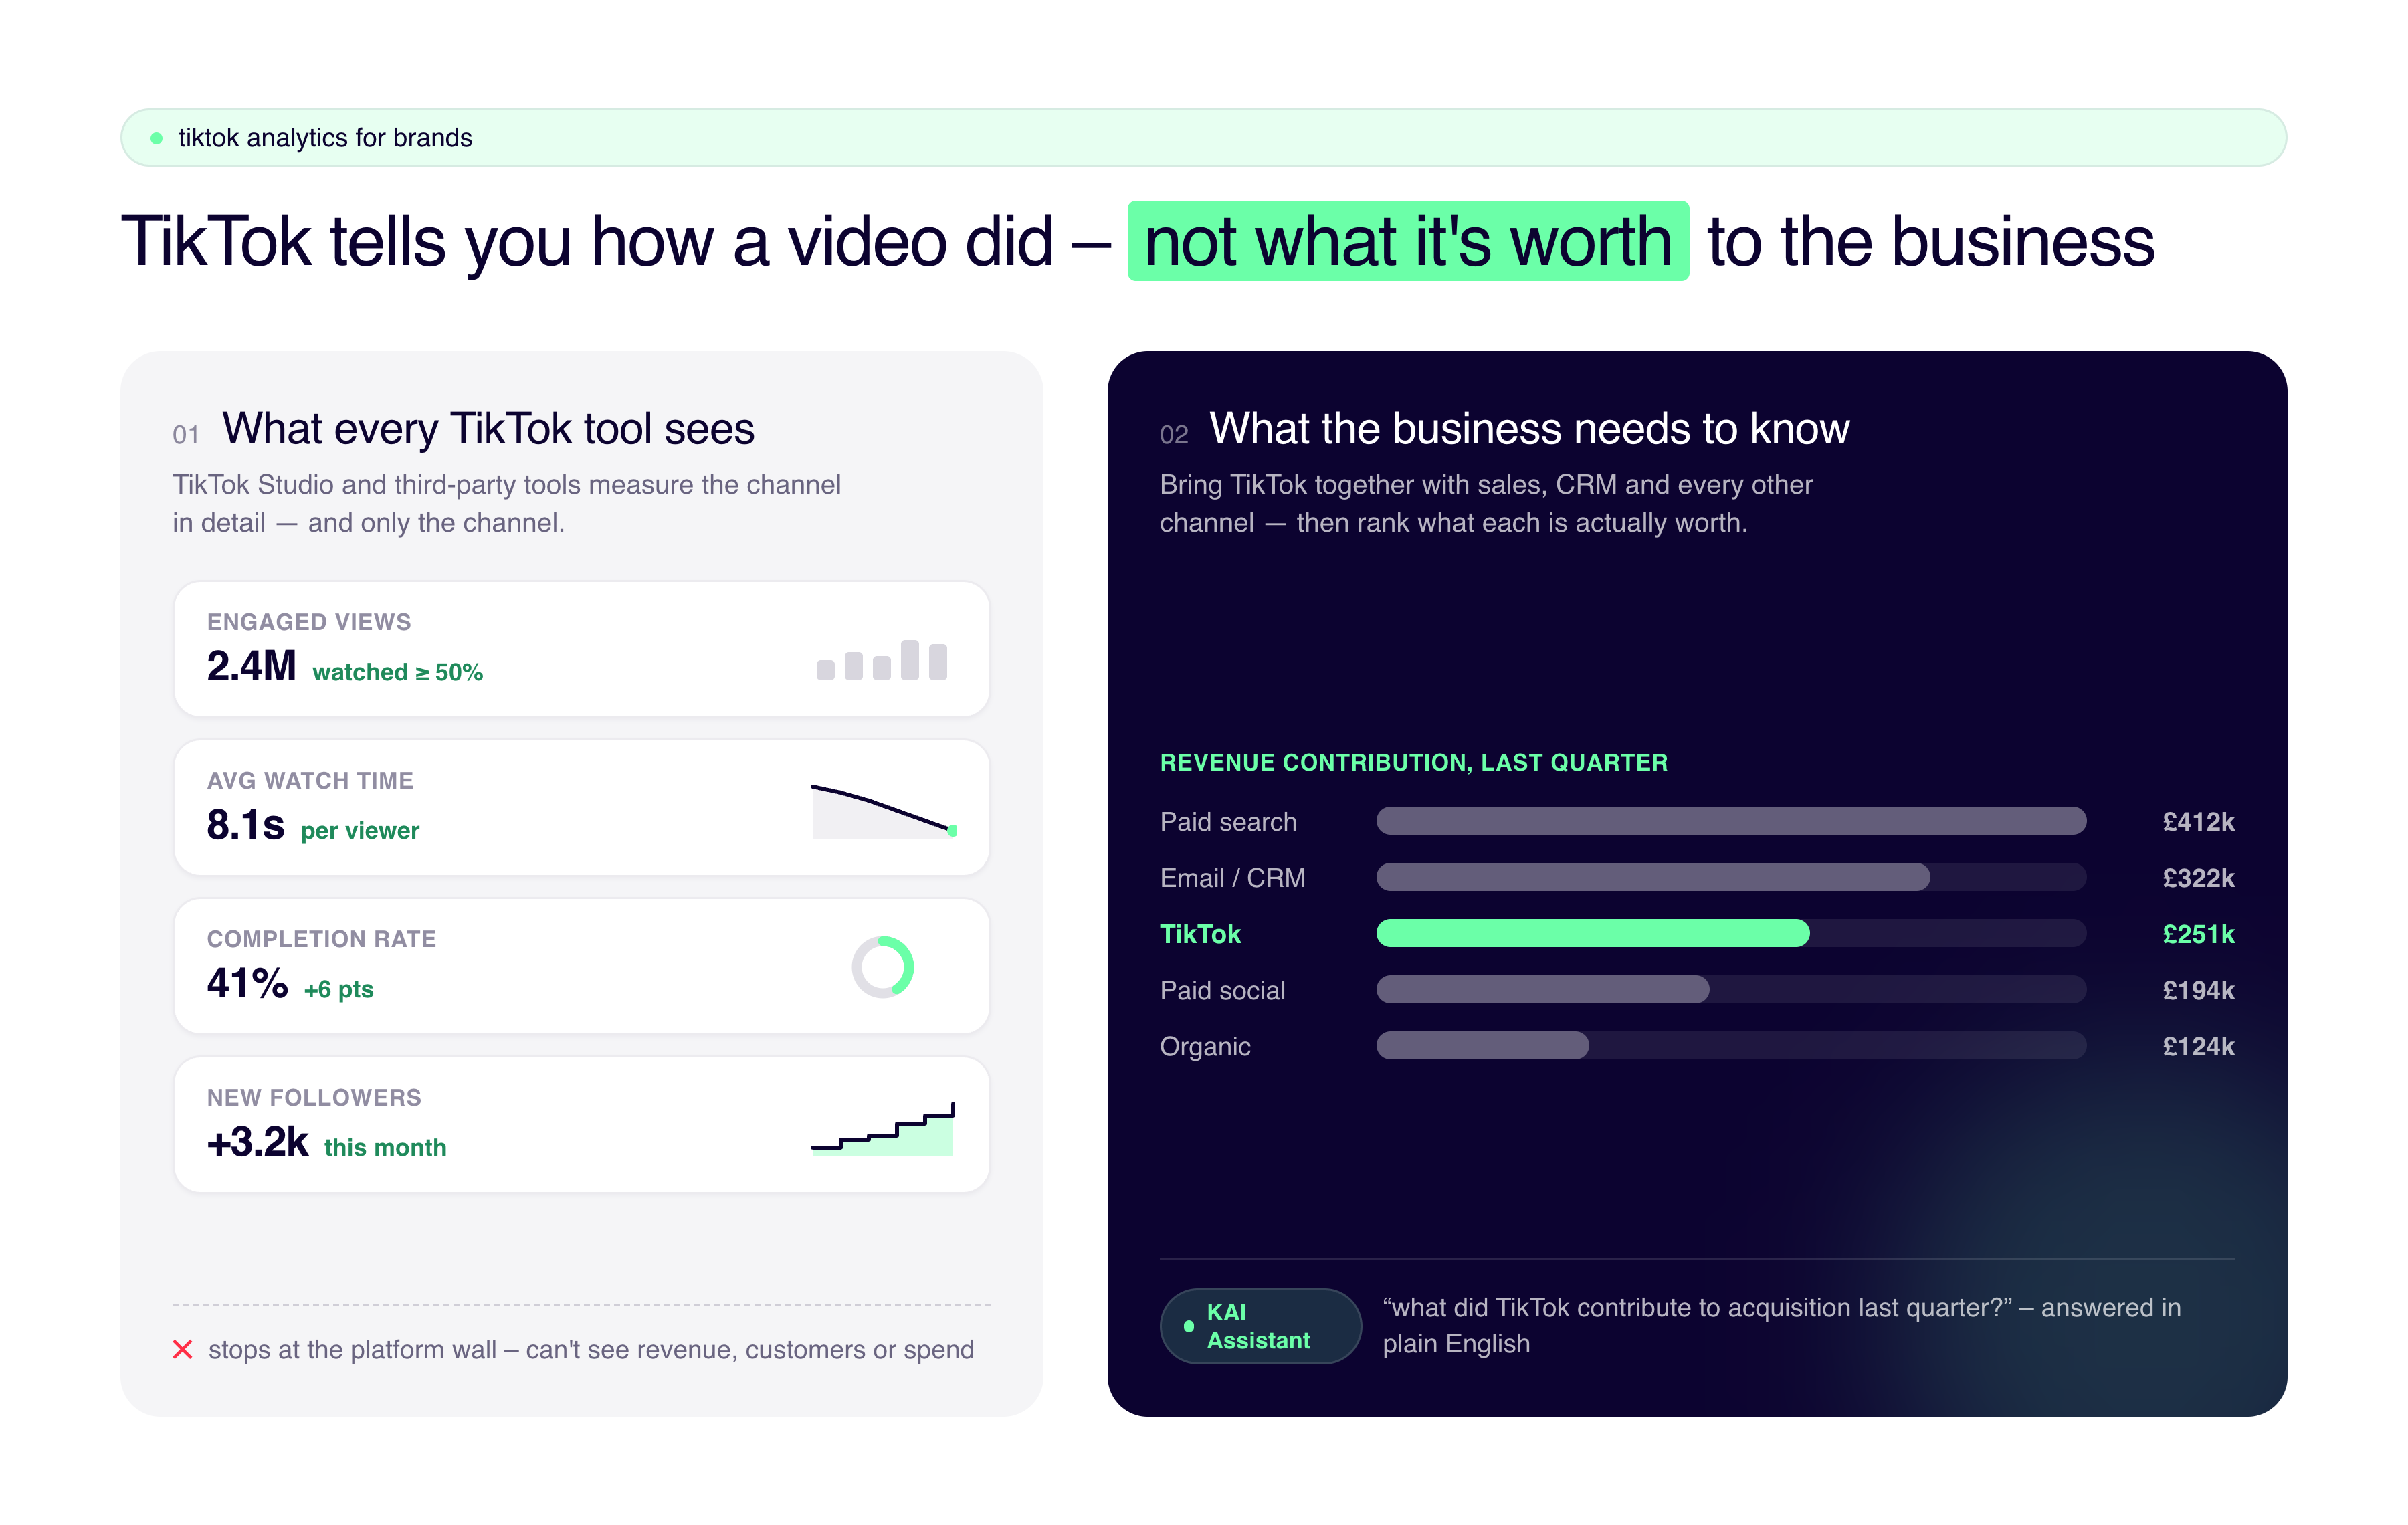
The analytics now live in TikTok Studio, on mobile and at the desktop business portal, available once you switch a personal account to a Creator or Business account. That part is still free and takes about thirty seconds. What's different is what it measures. The headline metric is no longer total views. It's Engaged Views, which count only people who watched at least half the video or a minimum of five seconds, and the dashboard now leads with average watch time per viewer rather than an aggregate figure that a single viral clip could distort. Raw view count still exists, but TikTok pushed it to a secondary tab, which tells you exactly how much weight the platform now wants you to put on it.
This matters beyond the dashboard, because the change reflects what the algorithm was already doing. Distribution now leans harder on completion rate and re-watches, so content people finish and return to gets pushed further than content that merely gets clicked. In plain terms: TikTok has decided that a view isn't a view unless someone actually watched, and it's built both the analytics and the recommendation engine around that. If your reporting still leads with view counts, you're measuring something TikTok has openly demoted.
The native dashboard: what it's actually good for
For a brand, TikTok Studio covers the content-level basics well, and it's the right first stop. It breaks down into a few areas worth knowing.
What TikTok Studio tracks in 2026
Dashboard area
What it shows
Overview
Engaged Views, average watch time per viewer, follower count, and profile views over time. The starting point for spotting trends. Note that raw total views now sit in a secondary tab.
Content
Per-video performance: completion rate, watch time, retention curves, and traffic sources. This is where you diagnose why one video landed and another didn't.
Followers
Audience demographics: age, location, and the hours they're most active, so you can post when your audience is actually online.
LIVE
Metrics for live streams, including peak concurrent viewers, watch duration, and followers gained during the session.
Search (Creator Search Insights)
How your videos perform in TikTok search results, reflecting TikTok's shift into a search surface. Access it by searching "Creator Search Insights" in the app.
Shop (Seller Center)
For TikTok Shop sellers, a separate dashboard entirely: GMV, product clicks, click-to-order rate, and affiliate performance. Not part of the content analytics.
There's also Creator Search Insights, which reports how your videos perform in TikTok's search results, a real acknowledgment that TikTok is now a search surface as much as a feed, and separate dashboards for LIVE (in TikTok Studio) and for TikTok Shop (in the Seller Center, not the content analytics at all). The takeaway for a brand is that TikTok's own analytics are useful for understanding how individual pieces of content perform, and completely siloed from everything else you do.
The third-party tools worth knowing
When the native dashboard isn't enough, most brands reach for a social analytics tool, and there's a reasonable field of them. The honest summary is that they mostly solve one of two problems: seeing more than TikTok shows you about your own account, or seeing across accounts and competitors that TikTok won't show you at all.
Tools like Metricool and Sprout Social sit in the social-media-management category, handling scheduling, cross-platform reporting, and TikTok performance in one interface, which suits a marketing team running several social channels at once. Pentos and Exolyt are more specialist, built around competitive and category benchmarking, with Pentos adding an engagement-quality score tuned to TikTok's 2026 metrics and Exolyt offering per-video retention benchmarking against category averages. They exist because TikTok's native analytics only ever show you your own account, and a brand usually wants to know how it's doing relative to competitors and the category, which the platform will never tell you directly.
All of these are good at what they do. They're also, every one of them, still about TikTok. That's the ceiling, and it's the ceiling that matters most for a business.
Where every TikTok tool stops
Here's the thing none of the tools above can do, and it's the thing a brand actually needs. They can tell you everything about your TikTok performance, and nothing about what that performance is worth to your business, because they can't see your business.
A TikTok analytics tool knows a video got a high engaged-view rate. It doesn't know whether the people who watched it bought anything, what they were worth, or whether the sale would have happened without the video. It can't connect a TikTok campaign to the revenue in your finance system, the customers in your CRM, or the spend on your other channels, because that data lives in your business, not on TikTok, and no platform-level tool has access to it. You end up with a beautifully detailed picture of one channel and no way to weigh it against the others, which is the exact problem TikTok's own "views aren't enough" shift is pointing at without being able to solve.
This is the point most marketing teams hit and then work around with a monthly spreadsheet, exporting TikTok numbers, exporting the other channels, exporting sales, and trying to reconcile them by hand. It works until it doesn't, and it never really answers the question, because a spreadsheet can't model which touchpoints actually influenced a purchase.
What actually answers the business question
Connecting channel performance to business outcomes is a data problem, not a social-analytics problem, and it's a different category of tool. This is the part where we describe what we build, for full disclosure.
Bringing your TikTok data together with your sales, CRM, ad spend, and every other channel in one place is what a data platform does, and it's what turns "our TikTok engagement is up" into "here's what TikTok contributed to revenue, and here's how it compares to everything else we're spending on." Once that data is unified, the interesting techniques become possible. Media mix modeling and digital attribution, which we've written about with our CPO, do exactly what a single-channel tool can't: weigh every channel against each other and model which touchpoints along a customer's journey actually drove the purchase, rather than crediting whatever they clicked last. The advantage over platform reporting is simply that we bring your transactional data to the model, which TikTok, GA4, and every social tool structurally cannot see.
With KAI Assistant on top, a head of marketing can ask what TikTok contributed to acquisition last quarter, in plain English, and get an answer grounded in the actual numbers rather than a chart from one platform's walled garden. That's the difference between knowing your TikTok metrics and knowing what TikTok is doing for the business.
So what should a brand actually use?
The honest stack looks like this. Use TikTok Studio for content-level performance, because it's free, native, and now built around engagement rather than vanity views. Add a third-party tool like Metricool, Sprout, Pentos, or Exolyt if you need cross-platform scheduling and reporting or competitive benchmarking the native dashboard can't provide. Those two layers handle the "how is our TikTok content doing" question well.
Then, when the question becomes "what is TikTok worth to the business, and how does it stack up against our other channels," that's where you've outgrown platform analytics entirely, and a data platform is the answer rather than a fourth social tool. Not every brand is at that point. If TikTok is a small experiment for you, the native dashboard alone is plenty, and we'd tell you so. But if TikTok is real budget sitting inside a real multichannel marketing spend, and you can't currently see it next to everything else, that gap is costing you more than a subscription.
If you want to work out where TikTok actually sits in your marketing performance, and connect it to the numbers that matter, bring us your setup and we'll give you a straight read. And if you're weighing the cost of a proper data platform against the patchwork of tools most teams end up with, our pricing comparison lays out the real numbers.


%201.svg)


%201.svg)
