How KAI Assistant speeds SQL generation and optimization
April 28, 2026
- min read
Most analytics tools are built around the assumption that the person using them already knows what they are doing. They give you a query interface, a dashboard builder, a set of filters. If you can find the right table, write the right SQL, and interpret the output yourself, great. If not, you are waiting for someone else to do it.
Conversational analytics software flips that assumption. Instead of requiring users to learn the tool, the tool learns to understand the user: you describe what you want in plain English, and the software figures out how to get it. The question of whether someone is "technical enough" to use it largely goes away.
In practice, the quality of what you actually get varies a lot depending on how well the tool understands your specific data environment, not just natural language in the abstract.
This guide covers what conversational analytics software actually does, what separates useful implementations from impressive demos, and how KAI Assistant inside Kleene.ai compares to the broader category.
TLDR
Conversational analytics software lets users query data, generate visualizations, and get answers from their data using plain English rather than SQL or BI tool interfaces. The market has grown quickly since LLMs became widely accessible, but the tools vary significantly in how much they actually understand your data versus just understanding your words. KAI Assistant is Kleene.ai's native conversational analytics layer, built directly into the ELT platform. Other tools in the space include Tableau Ask Data, Microsoft Copilot in Power BI, Thoughtspot, Looker with Gemini, Databricks SQL AI assistant, and Matillion with Maia, each covering a different slice of the workflow with varying degrees of data awareness.
What conversational analytics software does
The core idea is straightforward: you ask a question in plain English and get an answer from your data. "What were our top ten products by revenue last month?" should return a number, or better, a chart, without anyone writing a query.
But that is the easy version of the problem. The harder version is everything else that surrounds it: understanding which table holds the revenue data, knowing what your company means by "product" in the context of your specific schema, handling the fact that last month's data might sit in a different partition, returning something that a non-technical stakeholder can actually act on.
Tools that solve only the easy version are impressive in a demo and frustrating in production. The ones worth paying for are the ones that understand your data model, not just natural language.
Beyond direct data queries, conversational analytics tools typically cover some combination of the following: generating and explaining SQL, visualizing data inline without exporting to another tool, searching and inspecting data assets like tables or reports, debugging errors in queries or pipelines, and answering questions about how the platform or data model works.
What to look for when evaluating tools
Schema awareness. The single most important thing. A tool that works from your actual warehouse schema, knowing your table names, column types, and relationships, produces dramatically more useful output than one working from a general understanding of what data usually looks like. Ask any vendor you evaluate whether the tool has live access to your schema or is working from a cached or synthetic representation.
Visualization capability. Being able to generate a chart inline from a natural language request removes a significant amount of context-switching from a typical analyst workflow. Not all tools support this, and the ones that do vary in how flexible and accurate the output is.
Data privacy controls. Conversational analytics tools that work with sensitive data need clear, auditable controls over what gets sent to an LLM. Specifically: is raw customer data ever processed by the model, or does the tool work from metadata and synthetic previews? Who stores the conversation history and for what purpose?
Context awareness within the platform. A conversational tool that knows where you are in the platform, what transform you are working on, what pipeline just failed, produces much more relevant responses than one that treats every question as if it arrived with no context.
Scope of use cases. Some tools are built for business users asking questions about data. Others are built for data engineers managing pipelines. The most useful ones serve both, with different response modes depending on who is asking and what they need.
The tools worth knowing about
Tableau Pulse and Ask Data sit within the Tableau ecosystem and allow users to ask questions of their connected data sources in natural language. Ask Data generates visualizations from queries and has been integrated deeper into Tableau's interface over the past two years. The constraint is obvious: it works within Tableau's data model and is most useful for people already operating inside Tableau dashboards rather than working at the warehouse layer.
Microsoft Copilot in Power BI uses GPT-4 to generate reports, summaries, and DAX queries from natural language prompts. For organizations already running Microsoft Fabric or Azure, it integrates well with existing infrastructure. The quality of output depends heavily on how well the underlying semantic model is configured, which means setup still requires significant technical work before business users see much value.
Thoughtspot has built its product around search-driven analytics for several years, predating the current LLM wave. Its SpotIQ AI engine generates automated insights from connected data sources and its search interface is genuinely mature compared to newer entrants. The main limitation is that it sits at the analytics and visualization layer: it does not help with the underlying data engineering work that determines whether the data it is analyzing is clean and correct.
Databricks SQL AI assistant helps data engineers write and debug SQL queries within the Databricks environment. It understands the schema of the tables in your Databricks workspace and can suggest query completions, explain errors, and generate new queries from descriptions. Useful for engineering teams already on Databricks, but it is a SQL assistant rather than a full conversational analytics layer, and it does not extend to visualization or pipeline management.
Looker with Gemini brings Google's LLM capability into Looker's governed semantic layer. Users can ask questions against Looker's LookML model and get chart-based answers. The strength is Looker's governance: answers come from a business-defined semantic layer rather than raw tables, so there is less risk of different users getting different answers to the same question. The constraint is the implementation overhead of building and maintaining a LookML model in the first place.
Kleene.ai with KAI Assistant operates across the full data platform rather than sitting at a single layer. Engineers can generate SQL transforms against their live warehouse schema, debug pipeline errors with context-aware suggestions, and search transforms and logs in plain English. Analysts and business users can ask KAI to visualize data inline as charts, pull table schemas on demand, and get instant answers from the Kleene.ai documentation, all without leaving the platform or switching tools.
Matillion with Maia is a cloud data engineering platform with an AI assistant built in to help technical teams build ELT pipelines faster. Maia generates SQL transforms from plain English descriptions and helps engineers understand existing jobs without reading through them manually. It is useful for teams with significant pipeline construction overhead. The limitation is that Maia accelerates the engineering work, not what comes after it: there is no analytics layer, no visualization capability, and no path from pipeline to business decision.
How KAI Assistant compares
KAI Assistant is built natively into Kleene.ai rather than added on top of a separate analytics tool, and that distinction matters more than it might first seem. That means it covers a wider range of the daily workflow for both data engineers and analysts.
The six things you can do with KAI Assistant inside Kleene.ai:
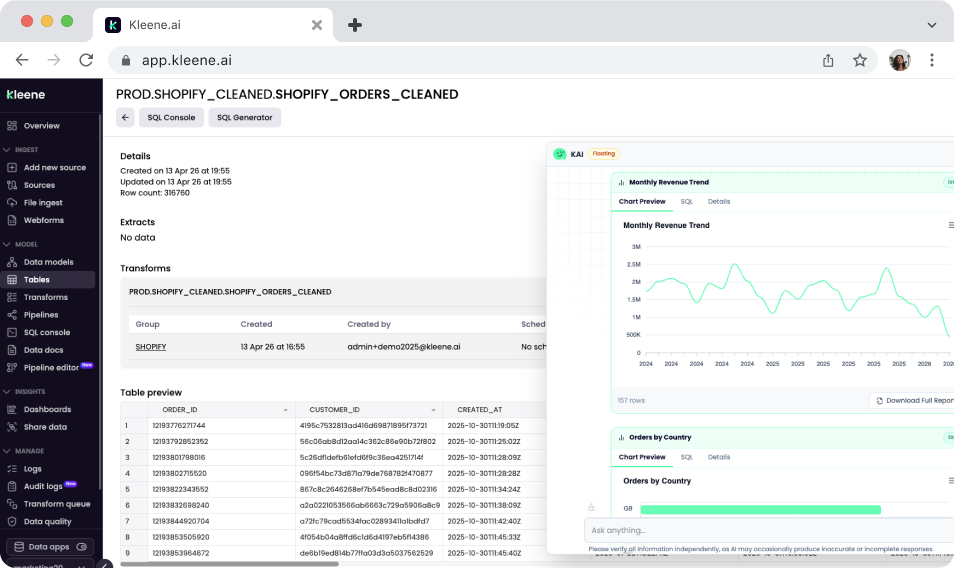
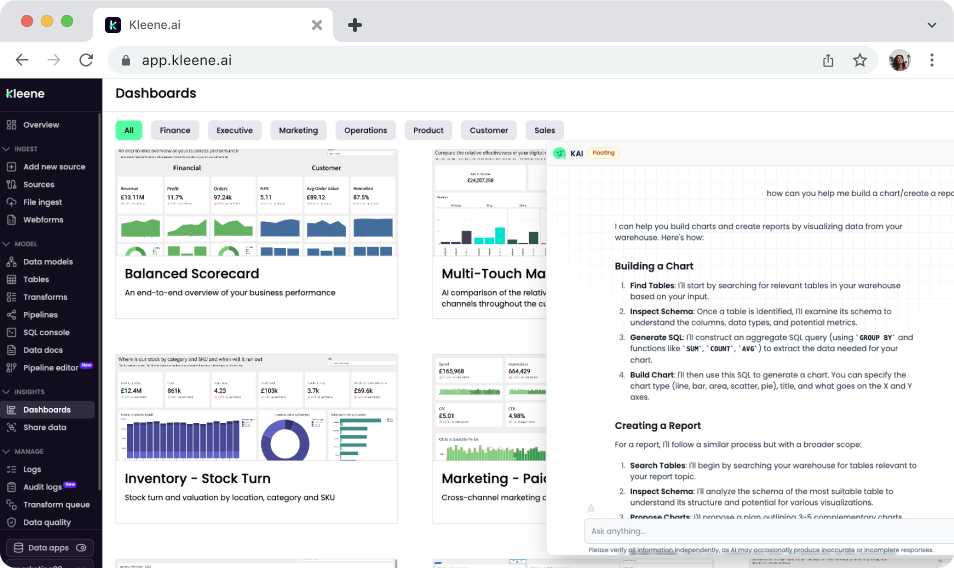
Generate and visualize data from plain English. Ask KAI to pull data and render it as a chart directly in the chat interface, without switching to a BI tool or running a query manually. "Create a bar chart of revenue by channel for the last 90 days" returns a visualization inline. This is the conversational analytics use case in its most direct form: question in, chart out, no SQL required.
KAI Assistant visualizing data
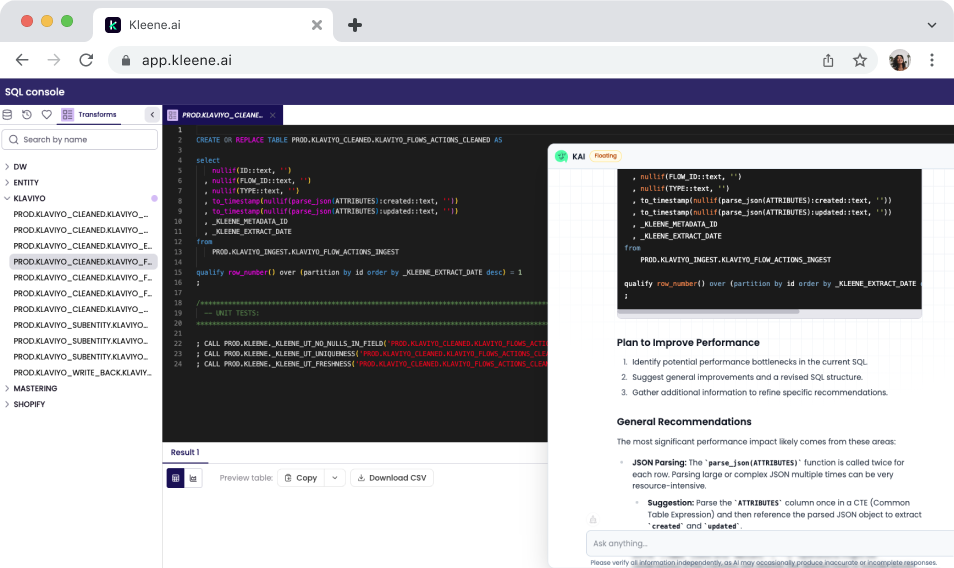
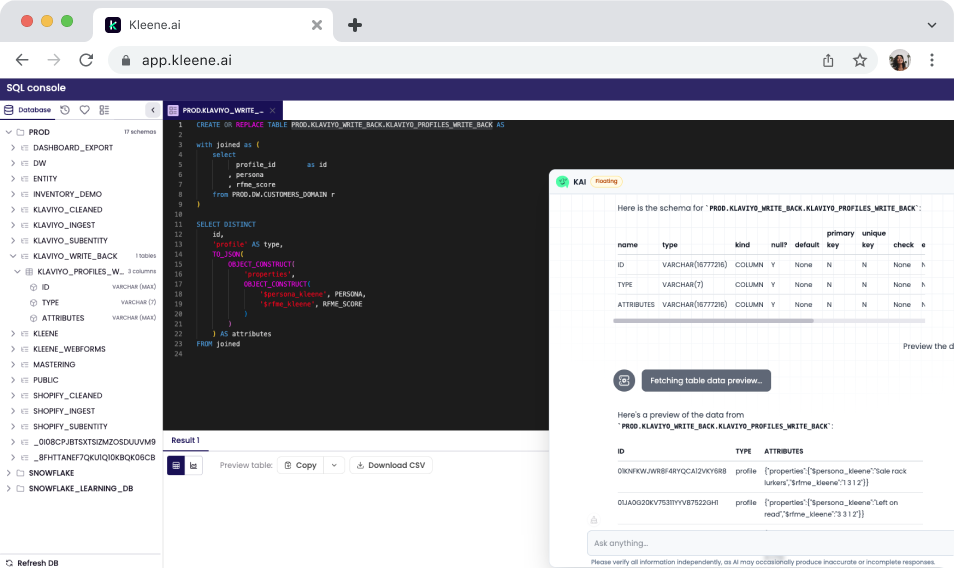
Generate and optimize SQL transforms. Describe the logic you need and KAI writes the SQL, informed by your live warehouse schema. Already have a transform that is running slowly or producing unexpected results? Paste it in and ask KAI to suggest improvements.
KAI Assistant optimizing SQL
Debug pipeline errors with context. When a transform fails, KAI reads the error against your pipeline structure and data model, explains what probably caused it, and suggests specific fixes.
KAI Assistant debugging a pipeline and suggesting fixes
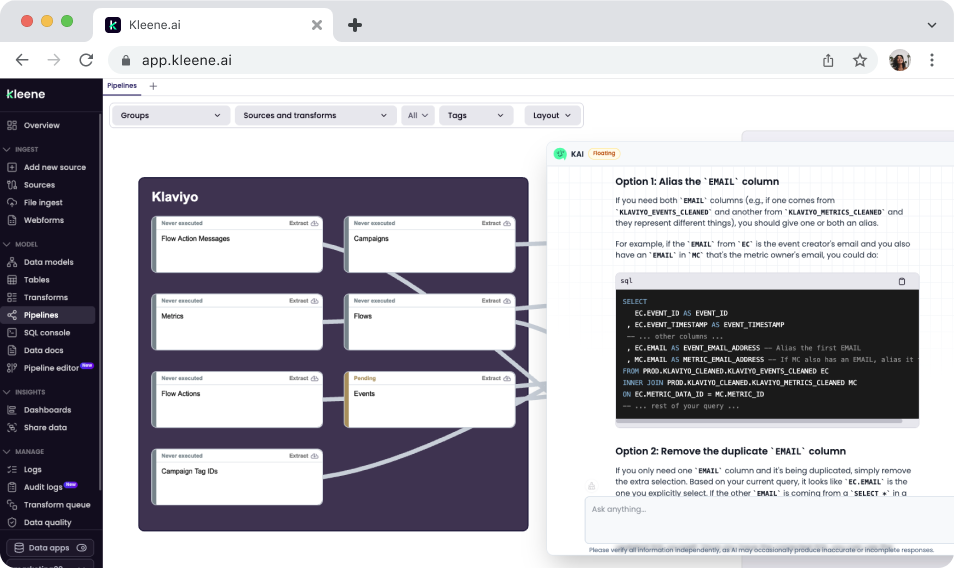
Search transforms, groups, and logs without manual hunting. If you manage a large number of transforms, finding a specific one or understanding what a group of transforms does collectively can take longer than the actual change you want to make. KAI lets you search by name, behavior, or description in plain English, and can explain what a transform does before you touch it.
KAI Assistant searching transforms from a natural language query
Pull table schemas and data previews on demand. Before writing a transform or running an analysis, understanding what the data actually looks like is usually the first step. KAI can return column names, data types, and sample previews from a plain English request, without running a manual query. When data previews are enabled, Kleene converts data to synthetic previews before any LLM processing, so raw customer data is not sent to the model.
KAI Assistant pulling table schemas on demand
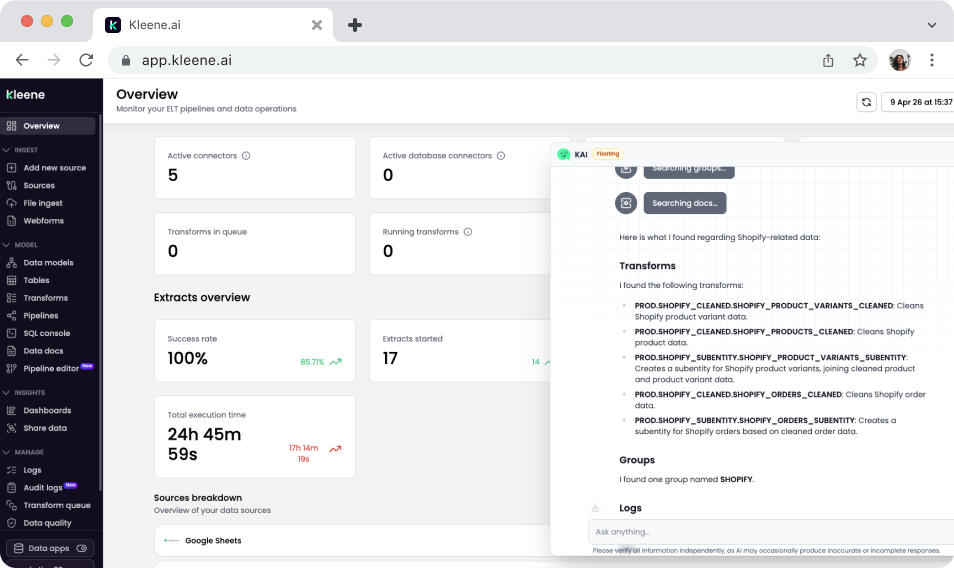
Answer Kleene.ai product questions instantly. For new team members or anyone hitting a feature they have not used before, KAI can answer questions directly from the Kleene.ai documentation without tab-switching or manual searching. The answers are grounded in the actual docs rather than a general understanding of how data platforms usually work.
KAI Assistant answering product questions
What KAI Assistant is not
KAI Assistant is not a standalone BI tool. It generates visualizations inline and can produce quick charts from natural language queries, but for full dashboard building, scheduled reports, and complex multi-chart views, Kleene.ai connects to dedicated BI tools like Sigma, Power BI, Tableau, and Looker.
It is not a replacement for a data analyst. It generates SQL starting points and can optimize existing queries, but the judgment call on whether a query is correct for the business logic it is trying to represent still sits with the person running it. KAI produces drafts that engineers and analysts review, not final answers that get published without scrutiny.
And it is Phase 1. The current capabilities focus on SQL generation, visualization, pipeline search, log debugging, schema inspection, and documentation. More is coming, including deeper pipeline-level intelligence and proactive anomaly detection.
Stay in the loop
Subscribe to the Kleene.ai newsletter and be the first to hear about new guides, data trends, and product updates.


%201.svg)
